18
$\begingroup$

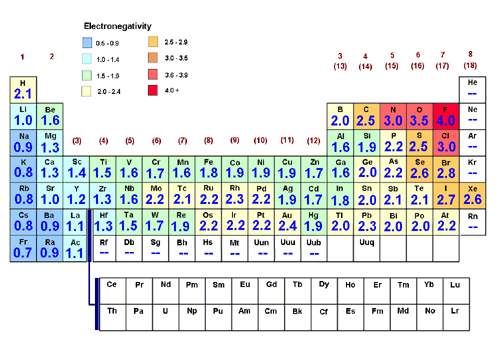
Looking at the Pauling electronegativities in the Periodic Table (below, from ChemWiki):
enter image description here

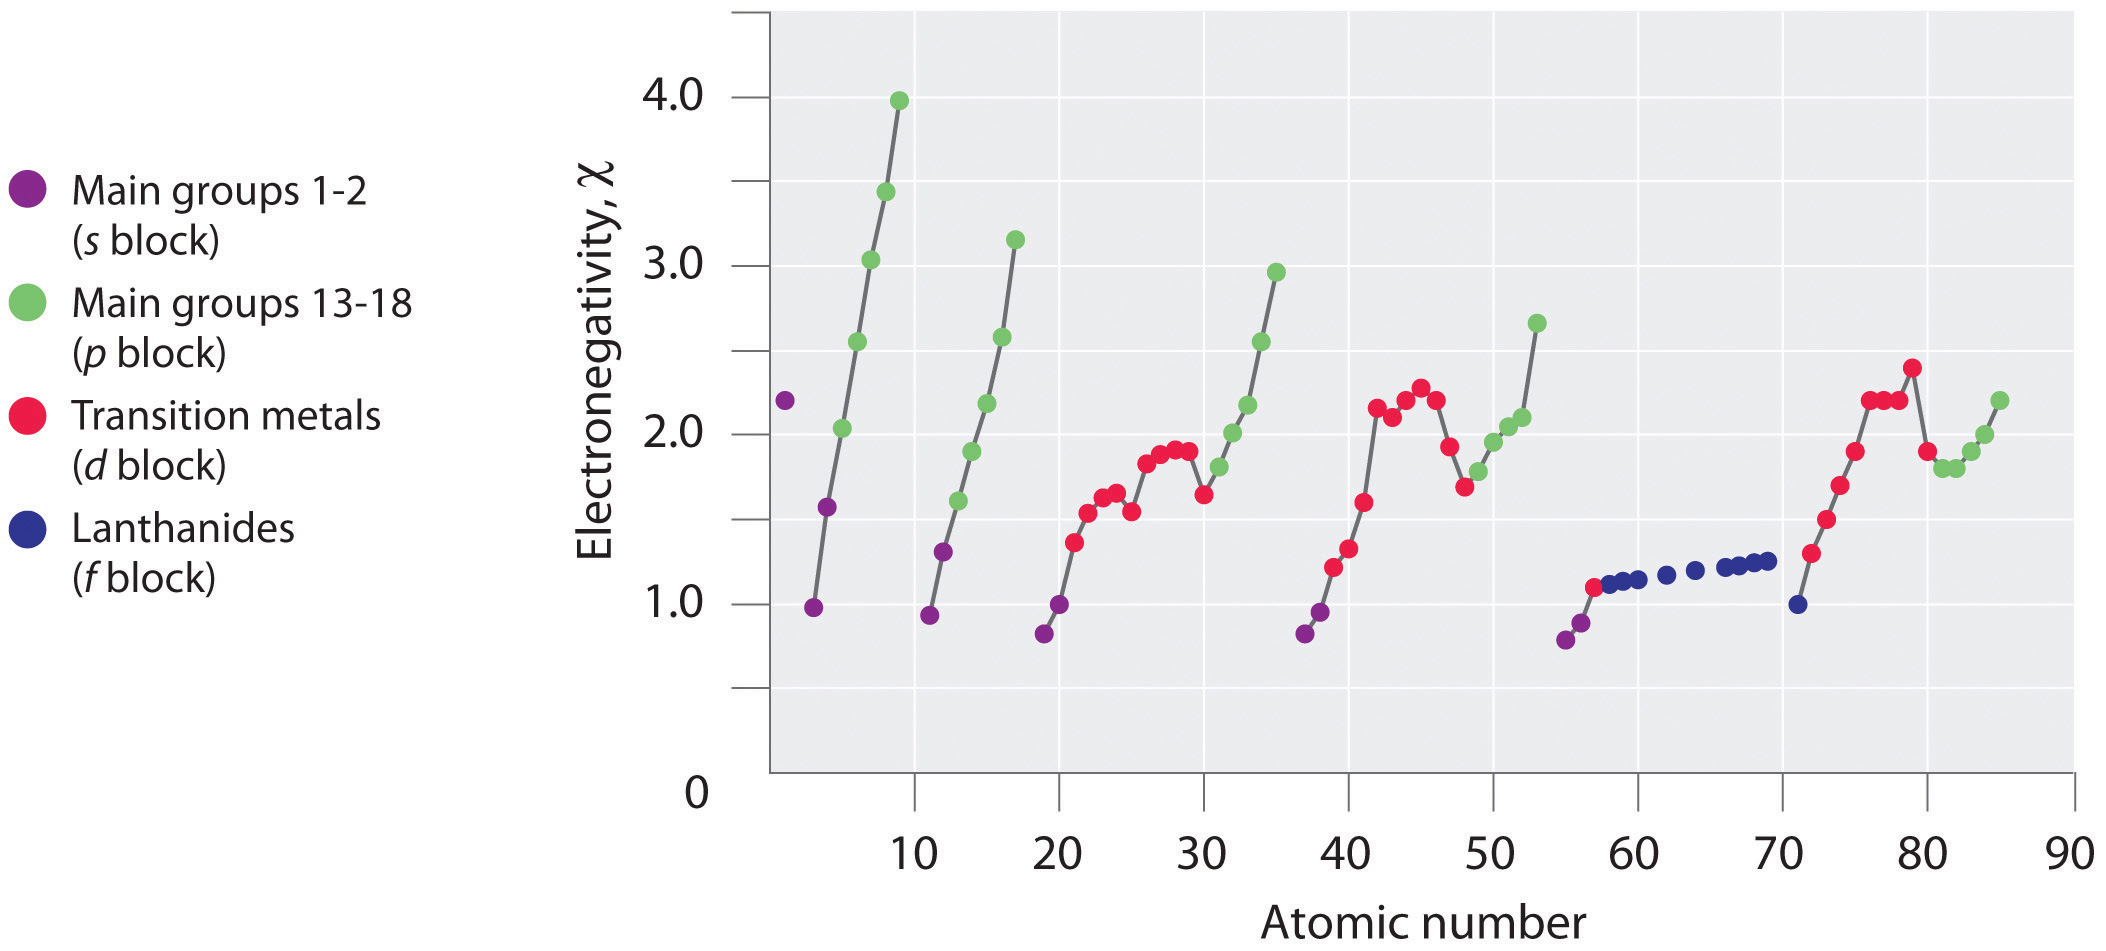
Asides from the overall trend of increasing electronegativity across and up the Periodic Table (towards fluorine), there seems to be a minor peak in the first 3 periods of the $d$-block elements, this peak becomes more pronounced as you go down the $d$-block, with the most noticable peaks in Periods 5 and 6 - seemingly the reverse of the overall trend. This is shown in the graph below (Image source):
enter image description here

In the ChemWiki page, there is also a reference to the Allred-Rochow Electronegativity Scale, which also has peaks occurring most prominently in Periods 4 and 6:

enter image description here

Image source

The Wikipedia page Electronegativity details several methods of calculation, which brings into question how well-defined the electronegativity values are; however, there still seems to be the peaks occurring, particularly in Periods 5 and 6, and to a lesser extent in Period 4.

What is the reason for these electrongativity peaks in the $d$-block?

$\endgroup$
4
  • 1
    $\begingroup$ Perhaps a question of more immediate concern before tackling the title question is, just how well-defined are the electronegativities for the transition metals? $\endgroup$ Commented Jul 5, 2015 at 1:27
  • 1
    $\begingroup$ @NicolauSakerNeto that could be part of an answer $\endgroup$
    – user15489
    Commented Jul 5, 2015 at 1:32
  • $\begingroup$ at your link they say nearly at the end (below slater's rules), that at the time allred and rochow constructed this scale the values for the covalent radius were wrong. they gave also a corrected table $\endgroup$ Commented Jul 5, 2015 at 1:39
  • $\begingroup$ Good points - I have added these details into the revised question $\endgroup$
    – user15489
    Commented Jul 5, 2015 at 2:19

2 Answers 2

1
$\begingroup$

You should know that closeness to filling a shell and atomic size are the reasons for the overall electronegativity trend. This also applies to the subshells, how close is an element to filling, or half-filling, a subshell? How large is the atom?

The atomic size trend for the d subshell is opposite to that of the overall trend. In period 4 the 3d subshell is deep in the core orbitals and the electron density is high, whereas in the lower periods the d orbital is more diffuse and can more easily accommodate more electrons, leading to a better energy payoff for completing the subshell. For the elements that take s electrons to fill the d subshell, this energy payoff is even greater from then filling the s subshell as they are very diffuse.

$\endgroup$
-4
$\begingroup$

The peaks in electronegativity for elements may be named as groups as next:

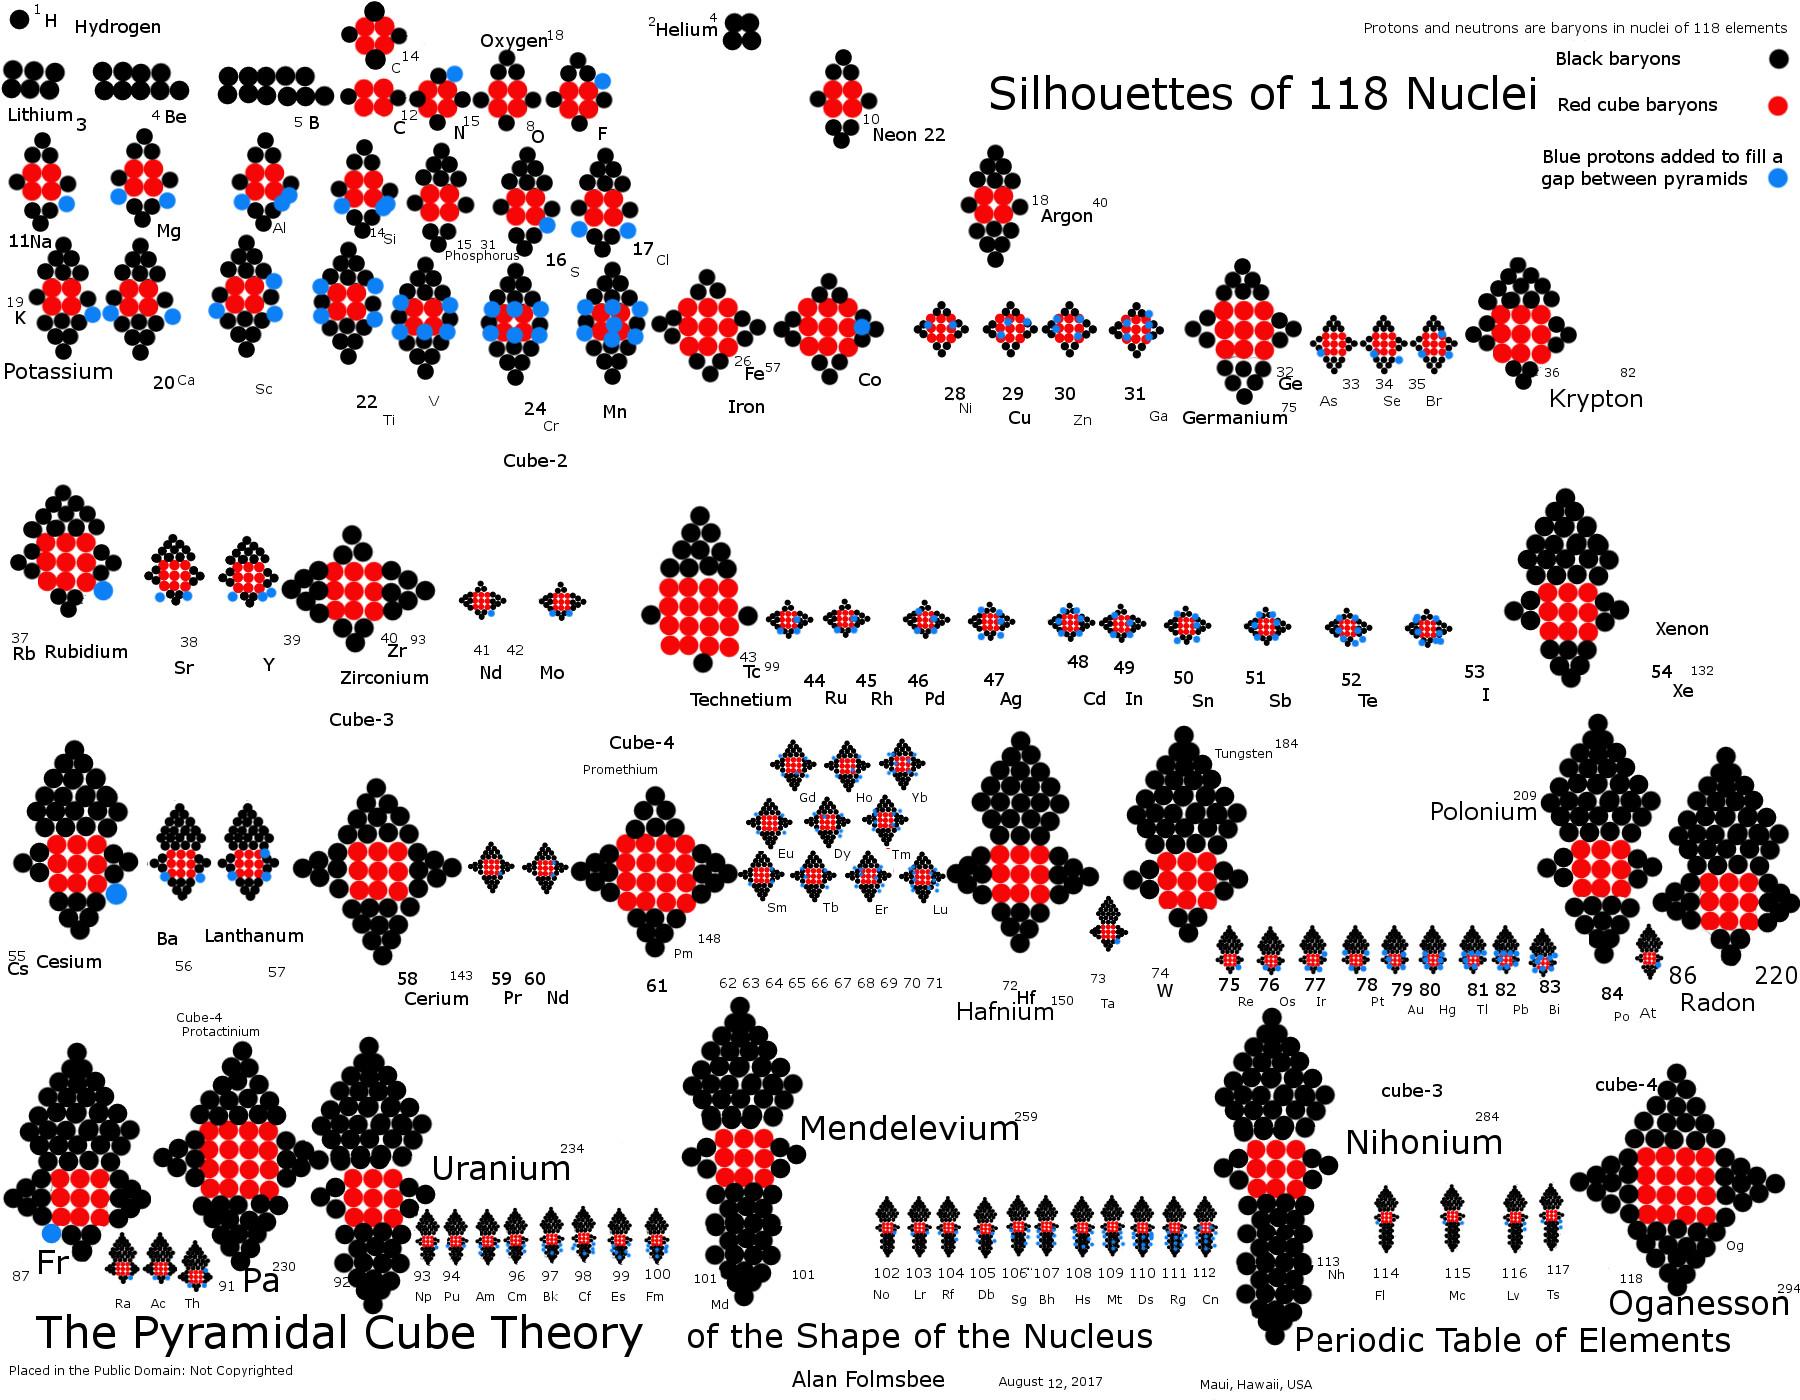
V Cr Mn has a peak and then Mn drops down. Iron is the key as shown next. Zr Nb Mo has a peak and then a a plateau. Zirconium is the key as shown next. My research is displayed : Periodic Table of Elements : Shape of Each Nucleus affecting electronegativity

enter image description here http://pyramidalcube.blogspot.com/2017/08/periodic-table-of-shapes-of-nuclei.html The shape of the nucleus affects the properties of the element. Notice how Manganese is the last in a series from the carbon core cube-2, then iron starts the cube-3 shape. That transition across the Table causes the abrupt change in electronegativity. Alan Folmsbee

$\endgroup$
3
  • $\begingroup$ Do you have a reference for this beyond a blog entry that you wrote yourself (which subsequently links to another blog)? $\endgroup$
    – jonsca
    Commented Nov 3, 2017 at 1:56
  • $\begingroup$ Dear Jonska, Neon has a shape like in my Table. phys.org/news/… and also Radon has a shape like in my table: ns.ph.liv.ac.uk/~lg/papers/… and also Barium has a shape like in the Table phys.org/news/2016-06-heavy-barium-nuclei-pear.html . I see a minus five insult from your welcoming committee. Progress is here, enjoy. $\endgroup$
    – Lug
    Commented Nov 6, 2017 at 15:54
  • $\begingroup$ I did not downvote, but as I mentioned, it was probably due to having insufficient references . It may help others if you incorporated brief summaries of some of that research into your answer rather than only the chart. $\endgroup$
    – jonsca
    Commented Nov 6, 2017 at 23:59

Your Answer

By clicking “Post Your Answer”, you agree to our terms of service and acknowledge you have read our privacy policy.