9
$\begingroup$

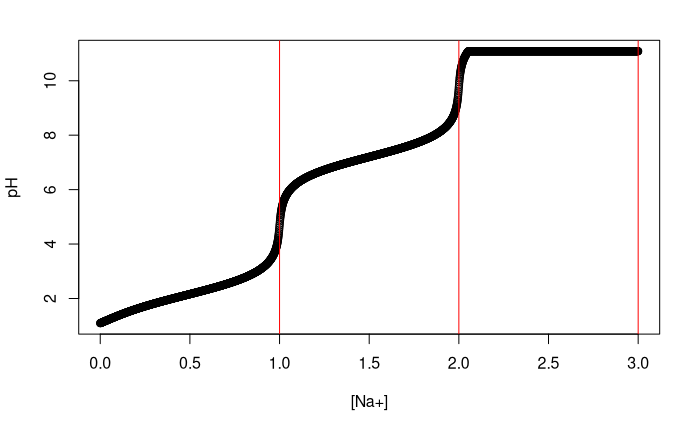
I've been learning how to simulate a 1M phosphoric acid titration curve using numerical methods in R.

So far has this has been the best curve:

enter image description here

Notice how it flattens out (artificially) towards the left.

I am not certain if this is a programming and / or a "chemistry" issue.


The system is defined by charge balance, mass balance, and equilibrium equations:

$$[\ce{H3A}] + [\ce{H2A-}] + [\ce{HA^{2-}}] + [\ce{A^{3-}}] = P_{CA}$$

$$[\ce{H+}] + [\ce{Na+}] = [\ce{H2A-}] + 2[\ce{HA^{2-}}] + 3[\ce{A^{3-}}] + Kw/[\ce{H+}]$$

$$K_{a, 1} = [\ce{H2A-}] [\ce{H+}] / [\ce{H3A}]$$

$$K_{a, 2} = [\ce{HA^{2-}}] [\ce{H+}] / [\ce{H2A^-}]$$

$$K_{a, 3} = [\ce{A^{3-}}] [\ce{H+}] / [\ce{HA^{2-}}]$$

I've posted a very similar question at SO and shared code for the simulation over there, using R's nleqslv::nleqslv (go have a look if you'd like to).

I thought this is also a good place for this issue. For instance, this answer (and the ones it links to) do seem to be useful, but I'm not sure how to solve that equation for $[\ce{H3O+}]$ (called $x$ over there).

I would like to know which is the best way to simulate a titration curve.

And also: are the equations I used correct? do you know what am I missing?

Thanks!

$\endgroup$
4
  • 1
    $\begingroup$ You may compare the visual result with other's solutions in the field, e.g. CurTipot, especially to avoid the sharp transition above $[\ce{Na+}] > 2$. And, for future reference, learn how to use mhchem in the body of a question / answer / comment on ChemSE (not in the title), e.g. here. $\endgroup$
    – Buttonwood
    Commented Mar 31, 2021 at 13:46
  • $\begingroup$ The exact answer, including the exact equation and titration curve, are already here: chemistry.stackexchange.com/a/43422/79678. I just found them. Also, the equation at the link is the same, except for trivial notation differences, as the one I have used for many years and use in an Excel spreadsheet here: chemistry.stackexchange.com/a/136203/79678. See the second spreadsheet. $\endgroup$
    – Ed V
    Commented Nov 16, 2021 at 22:53
  • $\begingroup$ So the answer I linked is one you already linked in your question! Argh! So I will do penance by telling you how to deal with that equation. You solve the equation just like in my spreadsheet (linked above). You can generate the titration curve two different ways. Easy way: pick a series of pH values in your desired range. Evaluate the equation for volume of added NaOH for each pH used. Then simply plot pH versus base volume added. This is the standard trick. Hard way: do algebra on the equation to yield a 5th order polynomial in hydrogen ion concentration. Solve that, using a root finder. $\endgroup$
    – Ed V
    Commented Nov 17, 2021 at 17:25
  • $\begingroup$ The hard way is how I make titration curves, since I use software with a nice root finder. Of course, you can use the equation with the solver in the Excel spreadsheet, but this is tedious because you would compute the pH for each base volume. $\endgroup$
    – Ed V
    Commented Nov 17, 2021 at 17:28

2 Answers 2

9
$\begingroup$

Much easier is to calculate the inverse function $[\ce{Na+}]=f([\ce{H+}],K_\mathrm{a1},K_\mathrm{a2},K_\mathrm{a3})$.

Calculate fractions of respective phosphate forms as the function of $\ce{[H+]}$ and acidity constants.

First, calculate the common denominator $CD$:

$$a_1 = [\ce{H+}]^3$$ $$a_2 = [\ce{H+}]^2 \cdot K_\mathrm{a1} = a_1 \cdot \frac {K_\mathrm{a1}}{[\ce{H+}]}$$ $$a_3 = [\ce{H+}] \cdot K_\mathrm{a1} \cdot K_\mathrm{a2} = a_2 \cdot \frac {K_\mathrm{a2}}{[\ce{H+}]}$$ $$a_4 = K_\mathrm{a1} \cdot K_\mathrm{a2} \cdot K_\mathrm{a3} = a_3 \cdot \frac {K_\mathrm{a3}}{[\ce{H+}]}$$

$$CD = a_1 + a_2 + a_3 + a_4$$

.. and then reuse it and its additive terms(*):

$$[\ce{H3A}]=c_0 \cdot \frac {a_1}{CD}$$

$$[\ce{H2A-}]=c_0 \cdot \frac {a_2}{CD}$$

$$[\ce{HA^2-}]=c_0 \cdot \frac {a_3}{CD}$$

$$[\ce{A^3-}]=c_0 \cdot \frac {a_4}{CD}$$

$c_0$ is the total phosphate concentration. From the fractions, you can get $\ce{[Na+]}$:

$$\ce{[Na+]} = \ce{[H2A-]} + 2 \cdot \ce{[HA^2-]} + 3 \cdot \ce{[A^3-]} + \frac{K_\mathrm{w}}{[\ce{H+}]} - \ce{[H+]}$$


There is one important thing to consider: Titration dilutes the acid.

If there is the volume $V_0$ of $\ce{H3PO4}$ with molar concentration $c_\mathrm{0,init}$, and if we spend the volume $V_1$ of $\ce{NaOH}$ solution of concentration $c_1$, then:

$$[\ce{Na+}]=c_1 \cdot \frac {V_1}{V_0 + V_1 }$$ $$c_0=c_\mathrm{0,init} \cdot \frac {V_0}{V_0 + V_1}$$

So perhaps the best approach can be:

  • There are given concentrations of respective solutions
  • For given volumes of respective solutions calculate $c_0$ and $\ce{[Na+]}$
  • For given $c_0$ and $\ce{[Na+]}$, calculate $\ce{[H+]}$ by finding the solution of the equation below ( $f([\ce{H+}]) = 0$ ) by numerical methods, like Regular falsi, or Newton one.

$$ \ce{[H2A-]} + 2 \cdot \ce{[HA^2-]} + 3 \cdot \ce{[A^3-]} + \frac{K_\mathrm{w}}{[\ce{H+}]} - \ce{[H+]} - \ce{[Na+]} = 0$$

For $y_1=f(x_1)$, $y_2=f(x_2)$, $y_1 \cdot y_2 \lt 0$, there is the Regula falsi iteration:

$$x_3 = \frac{x_2 \cdot y_1 - x_1 \cdot y_2 }{ y_1 - y_2}$$


(*) Note that the formulas are quite common, I have just rearrange them. They should be able to be found on internet. I have once derived them myself, but not this time, because I remember them.

$\endgroup$
2
  • $\begingroup$ Excelent! Thanks :) I'll post the code in another answer and accept yours. $\endgroup$
    – Naiky
    Commented Mar 31, 2021 at 22:54
  • $\begingroup$ Hi again! I've been through this again and thought I'd try getting an analytical solution too. Do you think this equation is right? Thanks! $\endgroup$
    – Naiky
    Commented May 22, 2021 at 4:48
4
$\begingroup$

The R code equivalent of Poutnik's answer, for refrence:

# Sumamente facil

Ka.1 <- 7.1 * 10^-3
Ka.2 <- 6.3 * 10^-8
Ka.3 <- 4.5 * 10^-13
Kw <- 10^-14

P_ca <- 1

pH.seq <- seq(from=0,to=14,length.out = 1000)

a1 <- function(H) H^3
a2 <- function(H) H^2 * Ka.1
a3 <- function(H) H * Ka.1 * Ka.2
a4 <- function(H) Ka.1 * Ka.2 * Ka.3
cd <- function(H) a1(H) + a2(H) + a3(H) + a4(H)

H3A <- function(H) P_ca * a1(H) / cd(H)
H2A <- function(H) P_ca * a2(H) / cd(H)
HA <- function(H) P_ca * a3(H) / cd(H)
A <- function(H) P_ca * a4(H) / cd(H)

OH <- function(H) Kw/H

Na <- function(H) H2A(H) + 2*HA(H) + 3*A(H) + OH(H) - H

Na.seq <- Na(H = 10^-pH.seq)

plot(Na.seq, pH.seq)

Also as suggested by Poutnik, a volume correction method was implemented here (it's not Newton nor regula falsi, I got lazy).

Plots

Get your plots here!

$\endgroup$
4
  • $\begingroup$ Note that [H+] giving [Na+]=0 means [H+] of H3PO4 solution at c0. Negative [Na+] have no chemical meaning, it is just mathematical extrapolation. There will be need of iteration as c0=f([Na+]). You dilute the solution by titration. $\endgroup$
    – Poutnik
    Commented Apr 1, 2021 at 4:44
  • $\begingroup$ See the A update, addressing dilution. $\endgroup$
    – Poutnik
    Commented Apr 1, 2021 at 6:50
  • 1
    $\begingroup$ R code syntax note: They could not use boring =, that had to use <- . I would hate to type it 1000 times. $\endgroup$
    – Poutnik
    Commented Apr 1, 2021 at 7:04
  • $\begingroup$ Sorry about the arrows "<-" indeed assignment is not the same as equality :P (Alt + - is handy). I wrote an approximation method for the correction, calculating [Na] as before, but using it as an estimate for updating solution volume, then repeat until convergence. Seems to not-crash, but I'm not sure it converges where it's supposed to. $\endgroup$
    – Naiky
    Commented Apr 1, 2021 at 14:59

Your Answer

By clicking “Post Your Answer”, you agree to our terms of service and acknowledge you have read our privacy policy.

Not the answer you're looking for? Browse other questions tagged or ask your own question.