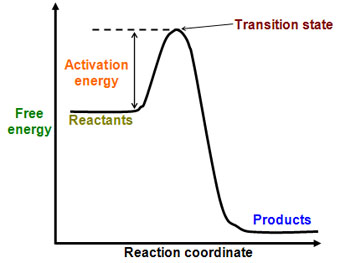
You are on the right track. The problem is with the diagram you show, which is just a cartoon, and describes something that is actually not the activation energy, although it is generally interpreted as this and as such is a good 'rule of thumb'.
The activation energy is experimentally derived as $\displaystyle E_A=-R\frac{\ln(k(T)}{d(1/T)}=\frac{RT^2}{k(T)}\frac{d k(T)}{dT}$.
where $k(T)$ is the rate constant at temperature $T$. However, this mathematical method imparts little or no physical information about what the activation energy is.
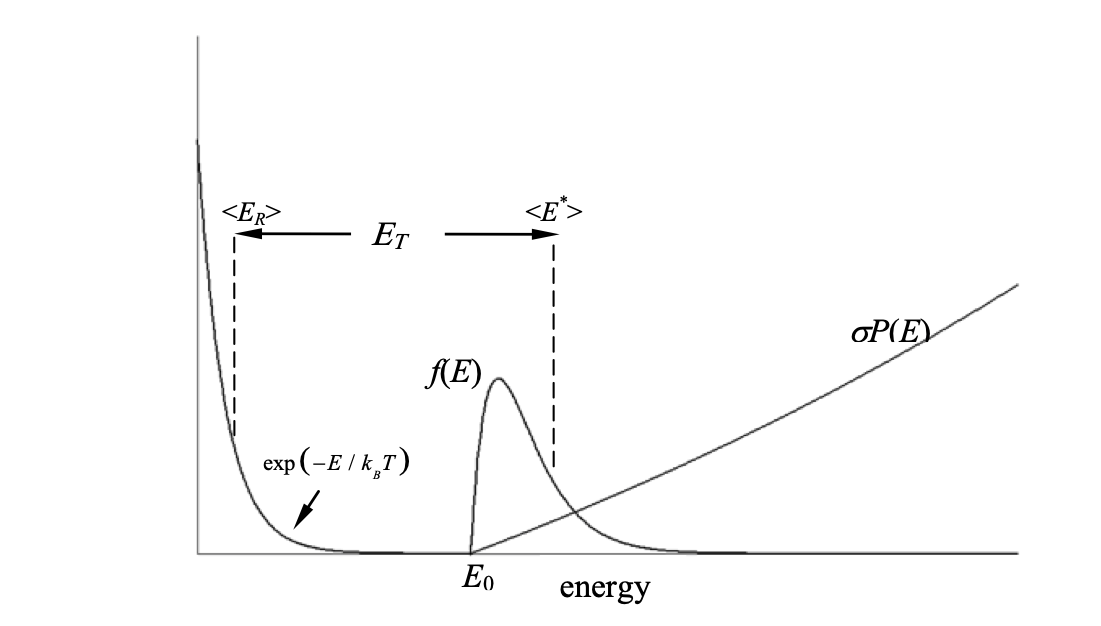
It is not just the height of the barrier above the bottom of the potential well, but has to reflect the fact that, in any experiment, the molecules are at a given temperature and so have a Boltzmann distribution of energies and conform to a Maxwell–Boltzmann distribution of collision speeds. Tolman interpreted this as shown in the figure.

Figure 1. Tolman interpretation of the activation energy. Shown are the rate constant with energy $k(E)\equiv \sigma P(E)$, the Boltzmann factor $\exp(-E / k_BT)$ and the product $f(E)=\sigma P(E)\exp(-E/k_BT)$ which is the probability of having energy $E$ at the transition state. Note that $E_T\ne E_0$ where $E_0$ is the threshold energy for reaction. ($f(E)$ is multiplied by a large factor to make it visible on the graph).
In the Tolman interpretation, the activation energy is the average total energy $\langle E^*\rangle$ (relative translational plus internal) of pairs of species that have reacted, minus the average energy of all $\langle E_R\rangle$ pairs of species whether or not they react, or $\langle E_T\rangle =\langle E^*\rangle -\langle E_R\rangle $.
Direct calculation via the Equipartition theorem gives the average energy of all pairs as $\langle E_R\rangle =3RT/2$ but the average of the reactive pairs is more complicated and depends on knowing how the rate constant $k(E)\equiv \sigma P(E)$ changes with energy and then $\langle E^*\rangle$ can be calculated.
The essential point in this idea is that the activation energy is the difference in the average energy in the reactants and the average energy in the transition state which is the average of $f(E)$ as shown in the figure.


