3
$\begingroup$

The setting of this problem is on the moon of Jupiter: Io.

Given that chlorine exists in two isotopes: $\ce{{}^{35}_{17}Cl}~(33.3\%)$ and $\ce{{}^{37}_{17}Cl}~(66.7\%)$, what is the mass spectrum of $\ce{Cl3+}$?

What I know now is that there are 3 peaks in the mass spectrum of $\ce{Cl2+}$ because there are 3 possible combinations ($\ce{{}^{35}_{17}Cl}$ + $\ce{{}^{35}_{17}Cl}$ / $\ce{{}^{35}_{17}Cl}$ + $\ce{{}^{37}_{17}Cl}$ / $\ce{{}^{37}_{17}Cl}$ + $\ce{{}^{37}_{17}Cl}$). Therefore, there are 4 possible combinations and 4 peaks for $\ce{Cl3+}$.

However, I do not know how to make a mass spectrum graph with only this much information.

$\endgroup$
1
  • 3
    $\begingroup$ Consider Pascal's Triangle. $\endgroup$ Commented Nov 18, 2014 at 19:42

1 Answer 1

5
$\begingroup$

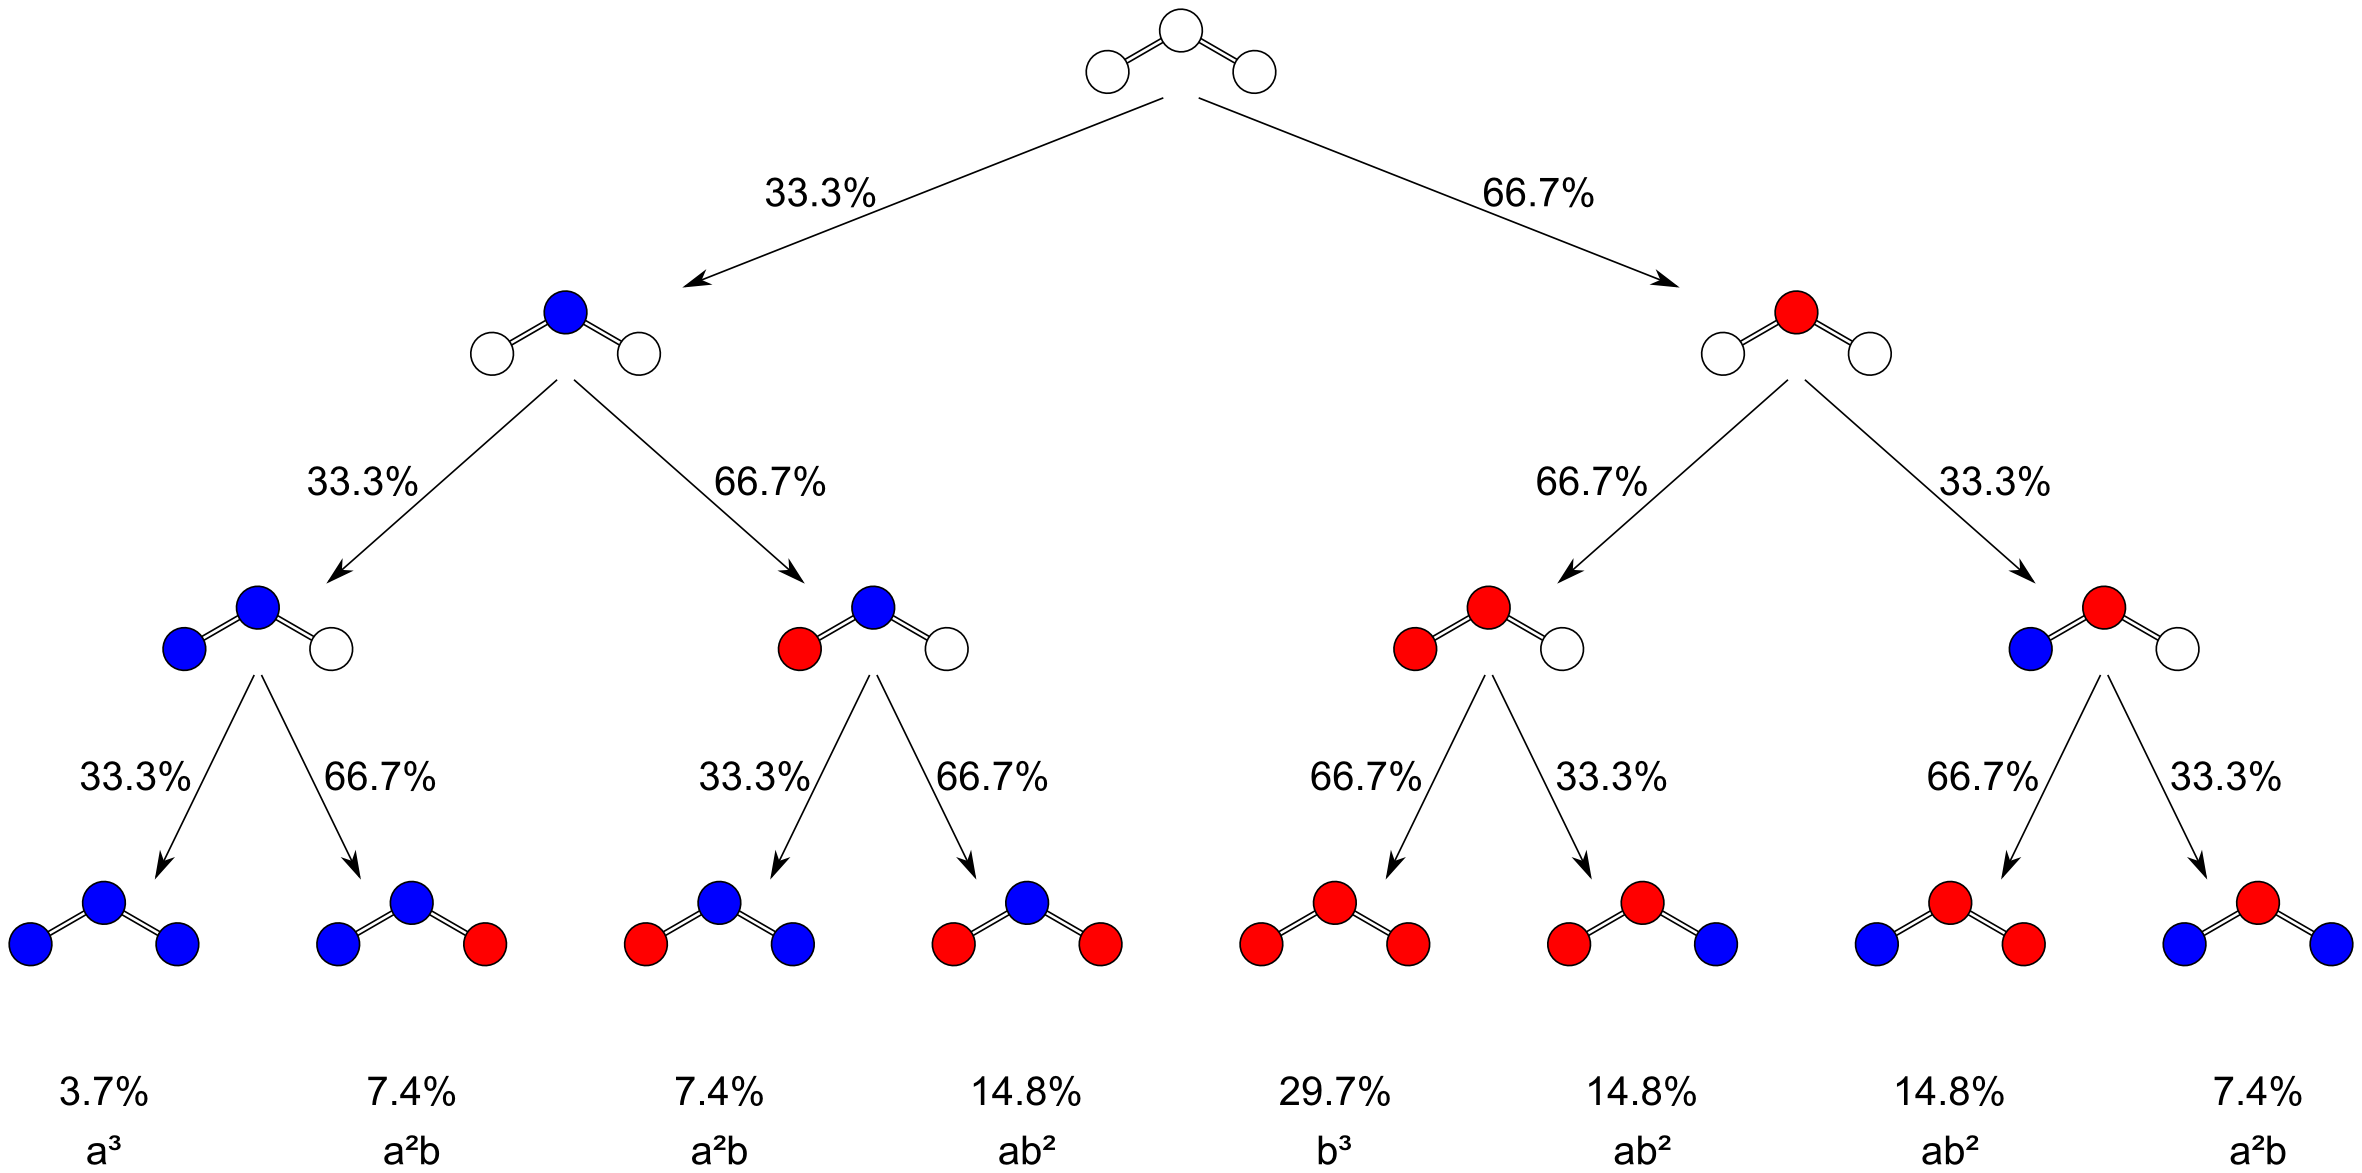
Okay, let's tackle this. First of all you worked out correctly that there are four different combinations, resulting in four different peaks. You have also given the probability for finding a $\ce{{}^{35}_{17}Cl}$ is $a=33.3\%\approx\frac13$ and the probability for finding a $\ce{{}^{37}_{17}Cl}$ is $b=66.7\%\approx\frac23$. Since you have three positions to fill, this will result in a binomial formula of third order, $(a+b)^3$. You can solve this easily with Pascal's triangle, $(a+b)^3 = a^3 + 3a^2b + 3ab^2 + b^3$. You spectrum should therefore look like this table: \begin{array}{lrr}\hline & \text{m/z} &\text{abundance}/\%\\\hline \ce{[{}^{35}_{17}Cl_3]^{+}} & 105 & 3.7 \\ \ce{[{}^{35}_{17}Cl_2{}^{37}_{17}Cl]^{+}} & 107 & 22.2 \\ \ce{[{}^{35}_{17}Cl{}^{37}_{17}Cl_2]^{+}} & 109 & 44.4 \\ \ce{[{}^{37}_{17}Cl_3]^{+}} & 111 & 29.7 \\\hline \end{array}

The following snowball diagram should further demonstrate this:
snow ball diagramm

$\endgroup$
6
  • $\begingroup$ I don't know mass spectro stuff but I guess in this line - "since you have three positions to fill, this will result in a binomial formula of third order" you probably meant "since you have four positions to fill..." (as there are four rows in your table) $\endgroup$ Commented Mar 9, 2018 at 6:25
  • 2
    $\begingroup$ @GaurangTandon No. Three atoms, three positions, three rows in the diagram, four different isotope combinations. $\endgroup$ Commented Mar 9, 2018 at 6:29
  • $\begingroup$ Aren't there eight possible combinations of isotopes? (as I see from the bottom row of your graph, and as is also easily observed from the fact there are three atoms in $\ce{Cl3+}$ each having two choices) $\endgroup$ Commented Mar 9, 2018 at 6:31
  • $\begingroup$ @GaurangTandon there are four different masses you can measure, because positions are irrelevant for that. There are six possible combinations, as there are symmetry equivalent ones. $\endgroup$ Commented Mar 9, 2018 at 6:35
  • $\begingroup$ "Six possible combinations" of what...? $\endgroup$ Commented Mar 9, 2018 at 6:42

Your Answer

By clicking “Post Your Answer”, you agree to our terms of service and acknowledge you have read our privacy policy.