3
$\begingroup$

I just began studying mass spectroscopy and I don't understand why certain peaks are not represented in the mass spectrum graph. Like let's say you have methyl or ethyl bromide. Usually, there are two equal molecular ion peaks at the right-most side, which indicate a $1:1$ ratio of $\ce{^{79}Br}$ and $\ce{^{81}Br}$ isotopes.

But this is only when you assume all carbon atom are $\ce{^{12}C}$. Why doesn't the graph show peaks with combination of $\ce{^{13}C}$ and bromine isotopes?

None of the examples online indicate this.

$\endgroup$
0

1 Answer 1

6
$\begingroup$

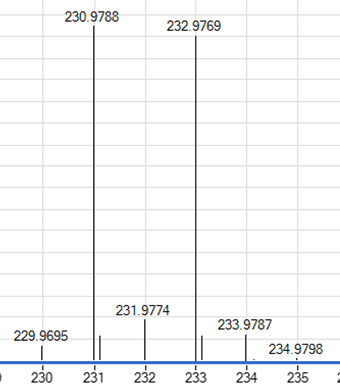
It does appear. The graphs you're looking at online probably just dumbed it down.

Here's some proof if you like, a compound synthesised by yours truly, with molecular formula $\ce{C7H7BrN2O2}$. I clipped the relevant part of the mass spectrum I got. This was done with ammonia gas CI, so instead of the $\ce{M^{+.}}$ radical cation we expect to see the $\ce{[M + H]+}$ quasi-molecular ion. We expect the following monoisotopic masses (I used this website to calculate these):

$$\begin{array}{ccc} \hline \text{Molecular ion} & m/z & \text{Predicted relative abundance} \\ \hline \ce{[C7H7^{79}BrN2O2 + H]+} & 230.9769 & 100.00 \\ \ce{[C6^{13}CH7^{79}BrN2O2 + H]+} & 231.9798 & 8.48 \\ \ce{[C7H7^{81}BrN2O2 + H]+} & 232.9749 & 98.01 \\ \ce{[C6^{13}CH7^{81}BrN2O2 + H]+} & 233.9777 & 8.29 \\ \hline \end{array}$$

enter image description here

$\endgroup$
2
  • $\begingroup$ Ahh... That's what I thought. Thank you so much for the clarification! $\endgroup$
    – TLo
    Commented Nov 26, 2016 at 3:40
  • $\begingroup$ okay. just saw it $\endgroup$
    – TLo
    Commented Nov 29, 2016 at 16:22

Your Answer

By clicking “Post Your Answer”, you agree to our terms of service and acknowledge you have read our privacy policy.

Not the answer you're looking for? Browse other questions tagged or ask your own question.