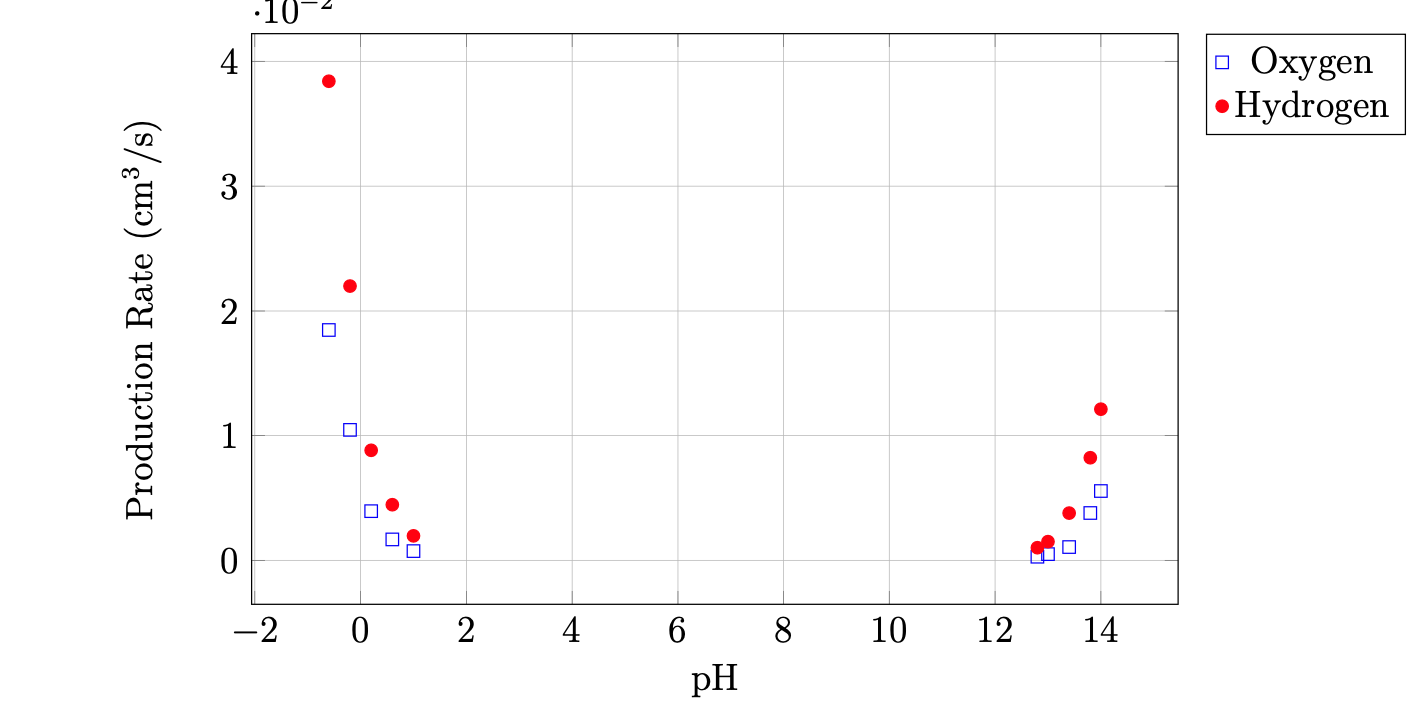
My experimental setup looks at using different pH solutions (of $\ce{H2SO4}$ and $\ce{NaOH}$) for electrolysis of water with a Hoffman setup and then measuring the rate of production of gas (note this is proportional to the current) at a fixed voltage.
Here are the results from my testing:
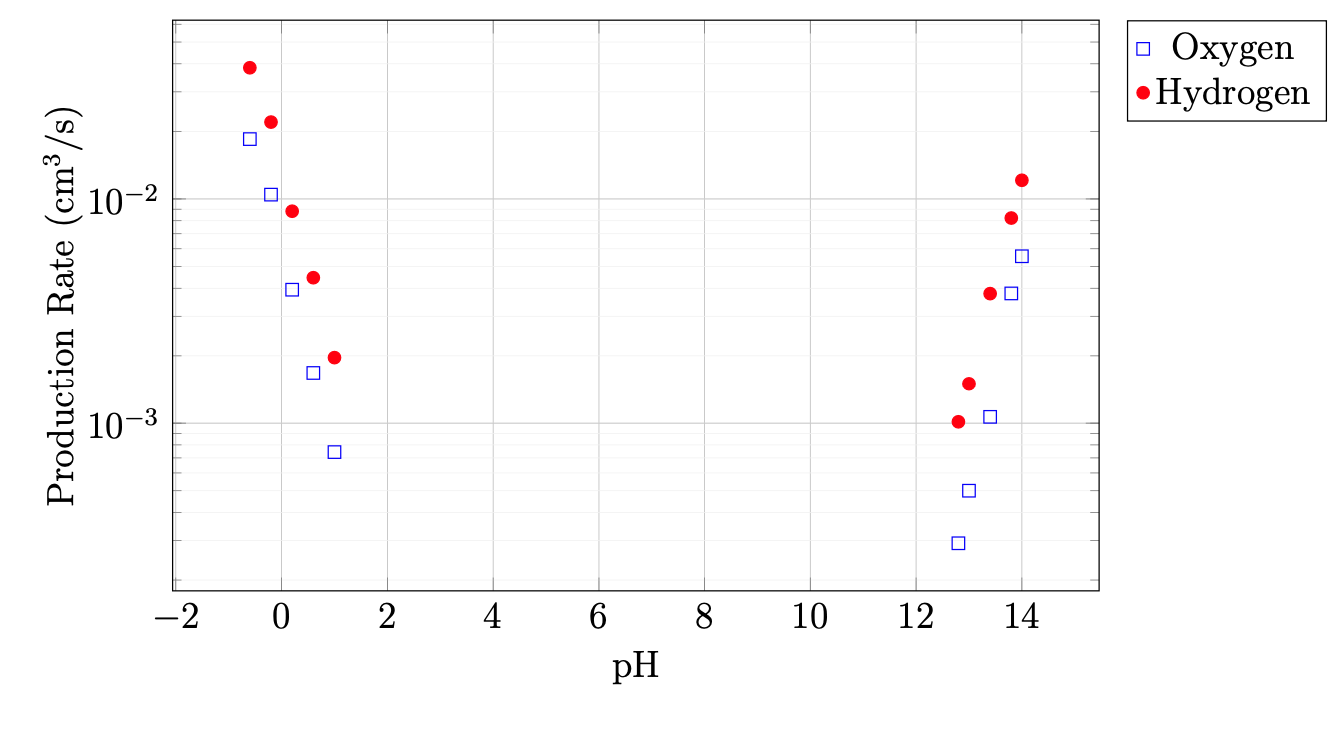
To make it clearer, here is a graph with logarithmic scale:
It is slightly misleading to look at the trend of oxygen as it redissolves into the solution much more than hydrogen, which is why its rate of production is slightly less than half of that of hydrogen.
My question is, what graph fit should I expect to see, I can't find anything on what it should theoretically be.
Should the best fit line be something like $y=e^{\lvert x \rvert}$?
If we look at the logarithmic graph, should it be in the shape of a quadratic ($e^{(x^2)}$) that goes through the points, should it be two straight lines ($e^{\lvert x \rvert}$)?
I'm not sure on what the theory says it should be. All help appreciated, thanks!


site:stackexchange.com OR libretexts.org OR wikipedia.org. // Specifically the site libretexts.org is focused on education community driven textbook-quality articles. // Gas gaining rate is roughly proportional to conductivity, which is roughly proportional to molar concentration for low/medium concentration, and - approximately - pH = - log (molar concentration) $\endgroup$