6
$\begingroup$

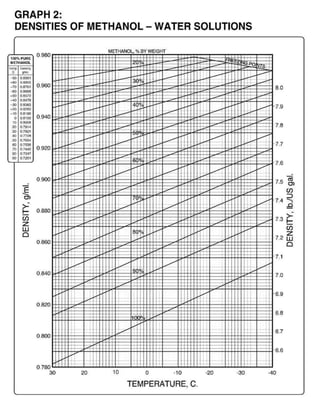
The company I'm working with uses a fuel mixture of methanol and water. We use a hydrometer to measure specific gravity, in order to test the composition of fuel received from our suppliers. To determine the weight percent of methanol we use a chart provided by The Methanol Institute that correlated specific gravity to weight percent at different temperatures.

Densities of methanol-water solutions
Click image for full-size PDF

I'm trying to build a spreadsheet for operators, suppliers, and customers to measure the specific gravity at an arbitrary temperature, enter the temperature and specific gravity measured, and get the weight percent without having to interpret a chart.

In order to do this, I need some sort of formula to calculate the weight percent for any input of specific gravity and temperature (within a reasonable range anyways).

Here are the approaches I've tried so far:

  • Fitting a line to the plot above and creating an empirical model. There isn't sufficient resolution in the plot to do this with any useful level of accuracy.

  • Finding the source information used to create this plot. I called The Methanol Institute and they have no idea where the plot came from, saying it's been used for years and they don't know a source or have any other related data. I tried calling Methanex, a major supplier of methanol which has published similar tables and charts, but I haven't gotten through to anybody so far.

  • Finding other sources for water/methanol mixes. One of my coworkers found a (printed) table with weight percent methanol in a water/methanol mixture for a wide range of temperatures and covering the weight percent range we're interested in. I scanned and OCR'd the table and created a plot. The table appears to lack sufficient resolution to develop an empirical model as well; with only 3 significant figures the lines appear wavy when plotted:
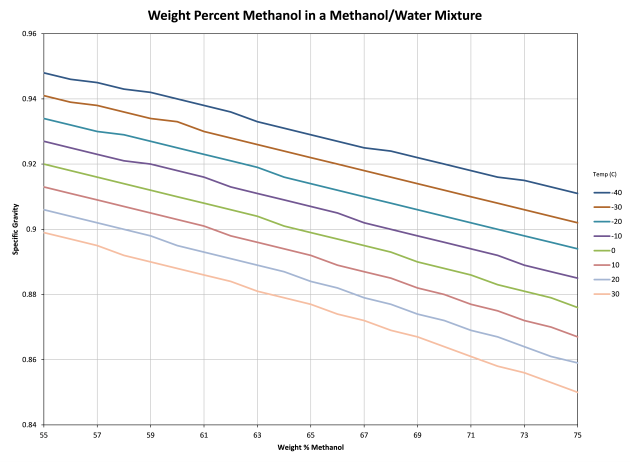
Weight percent methanol in a methanol/water mixture

  • Calculate using the specific gravity of pure methanol and pure water at a given temperature, then calculate the specific gravity of the mixture using an adjustment for the $\Delta V_{mix}$. This approach seems to work fairly well, but I could only find data for the change in volume due to mixing for 25 °C (page 12 of this PDF from Methanex). This table is "calculated from density and specific volume data" but no additional information is given. A reference table at the end of the document does have the specific volume of methanol at various temperatures, but nothing about change of volume when mixed with water specifically.

    I searched at length for methanol/water excess molar volume data. So far I've found data from various sources, but only at 20 and 25 °C, not over a range of temperatures.

  • Derivation from thermodynamics. I've pulled out my thermo textbook and am reading about equations of state and thermodynamics of mixing. I think given enough work I could probably derive a model from the thermodynamics approach, but I would prefer something based on actual measurements, since theory doesn't always match reality.


The actual question:

  • Is there an existing resource that would accomplish what I need?
  • If not, is there a source of good data on water/methanol mixtures at different temperatures that I might be overlooking?
  • Otherwise, is there a good source of data for excess molar volume over a range of temperatures (at least 18 – 30 °C, preferably wider) that I might be overlooking?
  • Is there a different approach I should consider?
$\endgroup$

3 Answers 3

4
$\begingroup$

You are looking for the excess molar volumes of water and methanol. A quick Google search shows that these quantities have been determined and re-determined dozens of times. The art is to find which paper has the best values.

The CRC Handbook of Thermophysical and Thermochemical Data and Landolt-Börnstein may have done the sanity check already.

$\endgroup$
4
  • $\begingroup$ I've found various sources for the excess molar volume (should've mentioned that), but I haven't found sources that report values over a range of temperatures. $\endgroup$
    – nhinkle
    Commented Oct 3, 2014 at 3:02
  • $\begingroup$ The sources are out there: Journal of Solution Chemistry, 2006, 35, 1315-1328 looks good, at least from the abstract. $\endgroup$ Commented Oct 3, 2014 at 3:13
  • $\begingroup$ This comes back to the same problem... all of the data in the paper you referred to were taken at 25 C. $\endgroup$
    – nhinkle
    Commented Oct 3, 2014 at 16:51
  • $\begingroup$ According to the abstract they offer up indices of refraction at different temperatures. That allows to infer the density, within limits. $\endgroup$ Commented Oct 3, 2014 at 16:57
1
$\begingroup$

Try this equation I found in a company manual...not sure about the source but I tested it against the monographs you can find at say http://www.methanol.org/Health-And-Safety/Safety-Resources/Health---Safety/Methanex-TISH-Guide.aspx, p7 and found it to be quite good...

Percent MeOH by wt. in MeOH-Water Solution = ((32.04 x (F8 x (0.0004745 x ((G8-32) x 0.555)+0.9894)))/(14.03 + F8 x (0.0147 x ((G8-32) x 0.555) - 9.53))) x 100

where F8 = Sp. Gr. of Soln. and G8 = Temp. of Solution in deg F

$\endgroup$
2
  • 1
    $\begingroup$ Welcome to chemistry.SE! Please visit this page, this page and this ‎one to improve and polish the formatting of your answer a little bit. $\endgroup$
    – M.A.R.
    Commented Apr 8, 2015 at 15:12
  • $\begingroup$ I'll point out that (G8-32) x 0.555 changes the temp to Centigrade. $\endgroup$
    – MaxW
    Commented Apr 9, 2016 at 16:24
0
$\begingroup$

Reading values off the plot (which, of course doesn't lend much precision) I was able to come up with the fit $$ww = K0 + K1T +K2\rho + K3T^2 + K4T\rho ... K9\rho^3 $$with $T$ being the temperature in °C and $\rho$ the density (IOW if specific gravity is measured multiply by 0.998203) and the coefficients

$$K0 =5870.6 ± 70.1$$ $$K1 =-19839 ± 234$$ $$K2 =7.2685 ± 0.23$$ $$K3 =23091 ± 260$$ $$K4 =-17.035 ± 0.507$$ $$K5 =-0.0152 ± 0.000543$$ $$K6 =-9127.5 ± 96.4$$ $$K7 =9.4966 ± 0.28$$ $$K8 =0.017299 ± 0.000596$$ $$K9 =3.498e-06 ± 1.49e-06$$

The 4th order fit with coefficients

$$K0 =-37002 ± 730$$ $$K1 =1.7281e+05 ± 3.26e+03$$ $$K2 =-88.78 ± 2.79$$ $$K3 =-3.0098e+05 ± 5.44e+03$$ $$K4 =303.88 ± 9.28$$ $$K5 =0.14152 ± 0.00672$$ $$K6 =2.3274e+05 ± 4.04e+03$$ $$K7 =-347.11 ± 10.3$$ $$K8 =-0.323 ± 0.0149$$ $$K9 =1.6286e-06 ± 1.57e-05$$ $$K10 =-67577 ± 1.12e+03$$ $$K11 =131.8 ± 3.78$$ $$K12 =0.18456 ± 0.00821$$ $$K13 =6.6375e-07 ± 1.73e-05$$ $$K14 =-1.9561e-08 ± 4.39e-08$$

is even a better fit matching the chart to within half a percent or better except in the corners (20%, - 40 °C) where the error is 1 - 1.5% and (90 - 100% at 30 °C) where it peaks at 1%.

$\endgroup$
5
  • $\begingroup$ Please visit this page, this page and this one on how to format your future posts better with MathJax and Markdown. $\endgroup$
    – andselisk
    Commented Jan 25, 2018 at 0:17
  • $\begingroup$ Used MathJax. Frankly don't see how this can be improved. It's the way it comes out of Igor. If it's good enough for Igor it's good enough for me. $\endgroup$ Commented Jan 26, 2018 at 22:25
  • $\begingroup$ I don't know who Igor is (if you are referring to a software package it's also irrelevant as WaveMetrics don't define standards, not to mention it's a closed-sourced code which cannot be audited). For proper typography see BIPM/NIST Brochure and IUPAC Green Book if you find links in my first comment insufficient. $\endgroup$
    – andselisk
    Commented Jan 26, 2018 at 22:38
  • $\begingroup$ I checked out the NIST and IUPAC documents and didn't really find anything about typography there. NIST wants us to use $t$ for celcius temperature but IUPAC is fine with $T$ reserving $t$ for time. I actually had $t$ originally but changed it to $T$ for clarity. $\rho$ is fine per IUPAC for density. So then I thought maybe it's expressing uncertainty as, for example $−1.9561e−08±4.39e−08$. NIST is fine with this unless the quibble is with using $e^{-8}$ instead of $x 10^{-8}$. If you can enlighten me as to specifically what the problem is that would help. On a bulletin board who cares? $\endgroup$ Commented Jan 26, 2018 at 23:41
  • $\begingroup$ TL;DR: I'd suggest to use subscripts for numerical indices (e.g. $K_1$), use $\pu{1.23e-4}$ instead of $1.23e-04$ and align set of equations about "=" sign (align environment and &= to denote the nodes to align about). $\endgroup$
    – andselisk
    Commented Jan 27, 2018 at 0:14

Your Answer

By clicking “Post Your Answer”, you agree to our terms of service and acknowledge you have read our privacy policy.

Not the answer you're looking for? Browse other questions tagged or ask your own question.