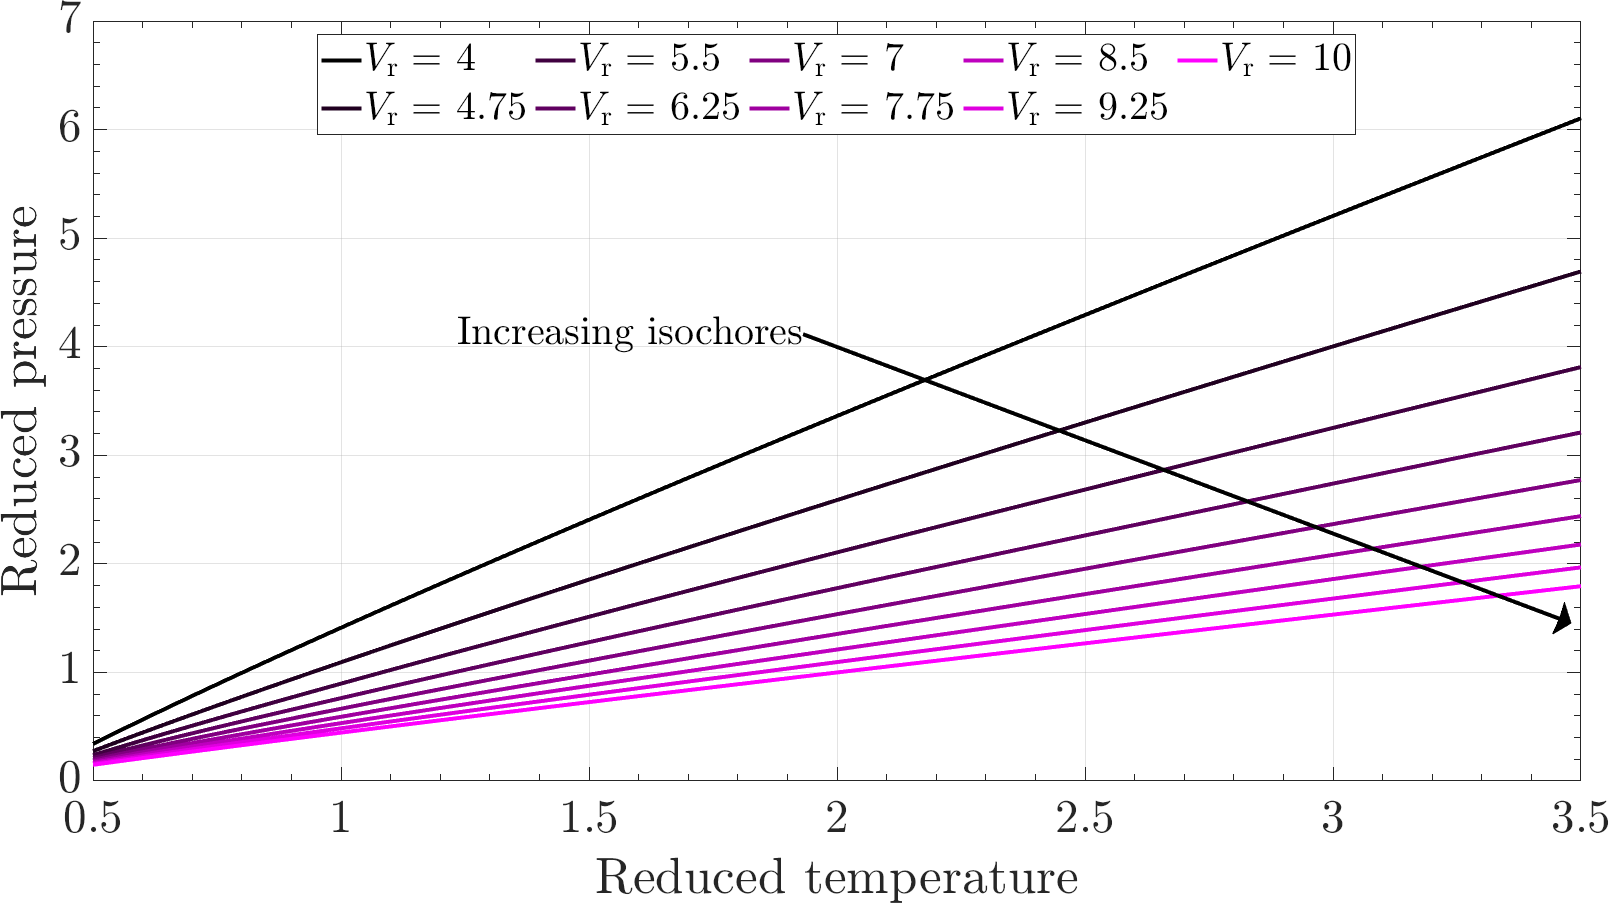
Typically, isochores in a $p-T$ diagram are straight lines. This is evident in the ideal gas law, but also a prediction from the simple van der Waals' equation of state.
We put this to test using a more sophisticated equation of state, the Peng Robinson's equation of state
\begin{equation}
p = \frac{RT}{V - b} - \frac{a}{[V + (1 - \sqrt{2})b)][V + (1 + \sqrt{2})b]}
\tag{1}
\end{equation}
Even though it still has two parameters, the one related to the attraction forces has a dependency with temperature
\begin{equation}
a = 0.45724\,\frac{\alpha(T_\mathrm{r},\omega)R^2T_c^2}{p_\mathrm{c}}
\tag{2}
\end{equation}
in which the accentric factor is taken into account via the correlation established by Peng and Robinson
\begin{equation}
\alpha(T_\mathrm{r},\omega) =
[1 + (0.37464 + 1.54226\omega - 0.26992\omega^2)(1 - \sqrt{T_r})]^2 \tag{3}
\end{equation}
The results are shown below:

This is a $p - T$ diagram but in reduced coordinates. There are ten isochores which are also displayed in reduced form. The supercritical region that interests you lies in the rectangle for which $p_\mathrm{r} > 1$ and $T_\mathrm{r} > 1 $. When $T_\mathrm{r}$ is rather low, there seems to be some curvature in all the isochores due to that both terms are important in the equation. However, for the supercritical region we have essentially straight lines. This agrees with the explanation given by Oscar Lanzi.
References
- The parameters for water used in the equation of state were extracted from the DIPPR Data Compilation of Pure Compound Properties, ASCII FIles, National Institute of Science and Technology, Standard Reference Data, Gaithersburg, MD, 1458 chemicals, extant 1995.
\begin{array}{|c|c|c|c|}
\hline
T_\mathrm{c} \; \pu{(K)} & p_\mathrm{c} \; \pu{(bar)} &
V_\mathrm{c} \; \pu{(dm3/mol)} & \text{Accentric factor} \\ \hline
647.1 & 220.55 & 0.0559 & 0.345 \\
\hline
\end{array}

