3
$\begingroup$

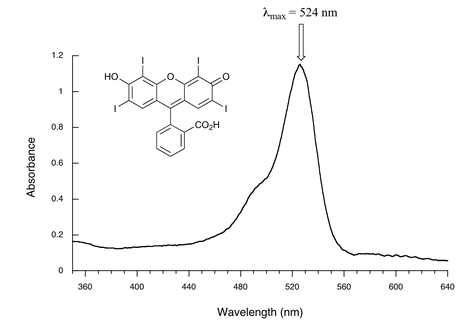
UV/Vis Spectroscopy is where electromagnetic radiation in the UV to Visible range is shone at a sample to be analysed. The absorbance of each wavelength is recorded and then plotted (very similar to Infrared spectroscopy). That's why it surprised me so much.

enter image description here

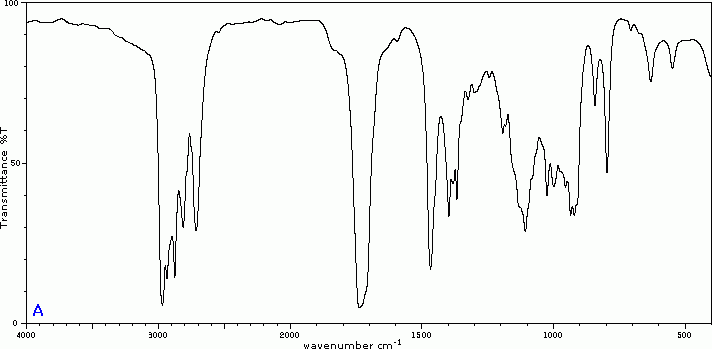
This graph is so smooth and with only 1 peak. This is completely different to the IR graph (below): enter image description here

Why is it that UV-Vis spectroscopy only produces 1 peak? Is it something to do with orbitals overlapping and hence only producing one major peak?

$\endgroup$
3
  • 6
    $\begingroup$ These spectroscopies measure different things, IR the vibrational motion of molecules in the ground state and the uv/vis primarily the electronic transitions from the ground state to each of higher energy excited states. The latter, however, do also show vibrational transitions, particularly when the molecule is in the gas phase and collisions with solvent do not 'smear out' the spectrum. Any decent book on spectroscopy will give you a complete description as will many phys. chem. text books. $\endgroup$
    – porphyrin
    Commented Jul 6, 2019 at 14:57
  • 1
    $\begingroup$ Also, UV-Vis spectra generally have more than one peak (even the one you show here), but the peaks often happen to be broad and to superimpose. The great difference that you note is in the changes that IR and UV radiations cause in the molecule (vibrational vs electronic excitation) $\endgroup$
    – user32223
    Commented Jul 6, 2019 at 15:08
  • $\begingroup$ The UV spectrum has a width of a factor two, the IR of one order of magnitude. $\endgroup$
    – Karl
    Commented Jul 6, 2019 at 20:32

1 Answer 1

3
$\begingroup$

I'm collecting ideas from the excellent comments and adding some of my own:

The typical UV/Vis spectrum has a narrow range

On the low energy side, it ends where the visible spectrum ends, at about 800 nm. On the high energy side, it ends where water and quartz start absorbing too much, at about 220 nm. Compared to an IR spectrum, it has a narrow range.

Most functional groups have no electronic transitions in that range

As far as organic compounds are concerned, the most common functional group to absorb in the UV is the benzene ring, and extended conjugated systems (e.g. beta carotene) will have electronic transitions in the visible. On the other hand, most organic functional group will show vibrational transitions in the range of a typical IR spectrum.

Peak widths

The spectrum of an electronic transition is broad because it is coupled with vibrational and rotational transitions. An example is the electronic spectrum of iodine:
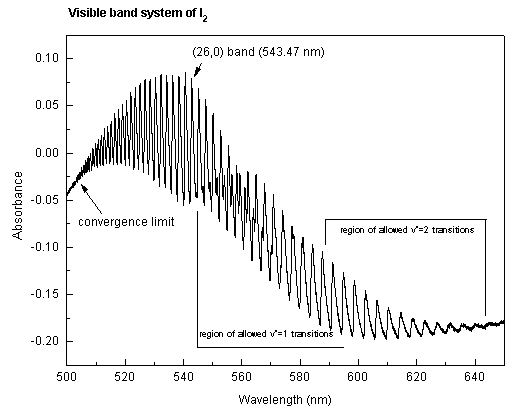
enter image description here

Source: https://chem.libretexts.org/Bookshelves/Physical_and_Theoretical_Chemistry_Textbook_Maps/Map%3A_Physical_Chemistry_(McQuarrie_and_Simon)/13%3A_Molecular_Spectroscopy/13-06._Electronic_Spectra_Contain_Electronic%2C_Vibrational%2C_and_Rotational_Information

In solution, the bands are not resolved, so the spectrum appears as a single broad peak.
$\endgroup$

Your Answer

By clicking “Post Your Answer”, you agree to our terms of service and acknowledge you have read our privacy policy.

Not the answer you're looking for? Browse other questions tagged or ask your own question.