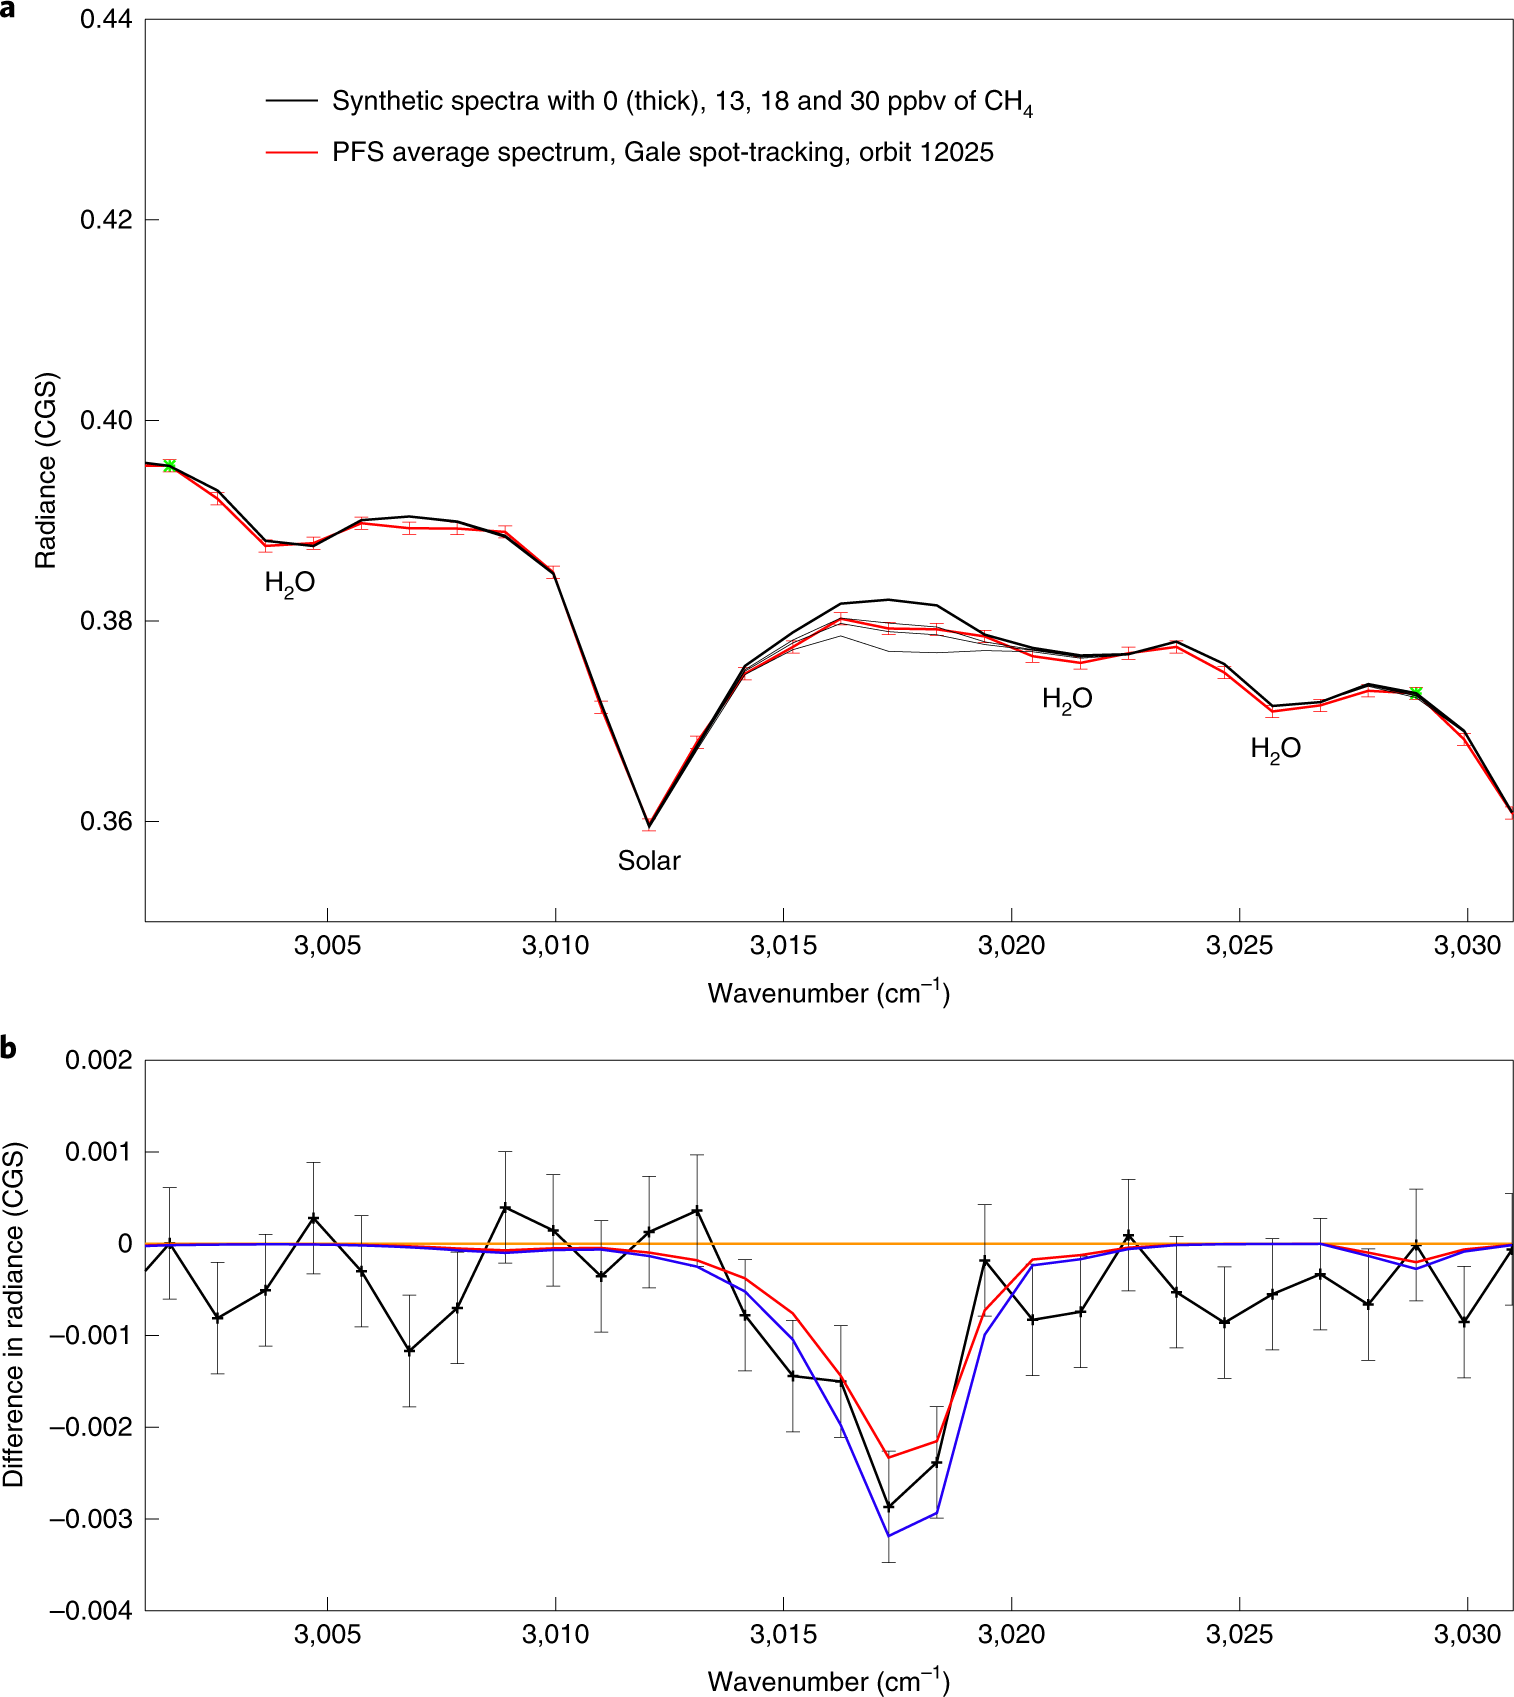
The recent paper in Nature Independent confirmation of a methane spike on Mars and a source region east of Gale Crater is interesting and the basis is a reanalysis of 2013 data taken by a X spectrometer about the Mars Express spacecraft in orbit around Mars looking down at the Martian atmosphere.
The paper itself is paywalled but the supplemental data describes the reanalysis in great detail.
The Planetary Fourier Spectrometer [38] (PFS) on Mars Express 37 is a double-pendulum infrared Fourier spectrometer optimized for atmospheric studies. It has two distinct spectral channels operating simultaneously and covering the wavenumber range between 200–2000 cm−1 (Long Wavelength Channel, hereafter LWC) and 2000–8300 cm−1 (Short Wavelength Channel, hereafter SWC). Both channels have a sampling step of 1 cm−1 and a spectral resolution of ~1.3 cm−1, when no apodization function is applied, and ~1.8 cm−1 when a Hamming function is applied to the measured interferograms (as in the case of the present work).
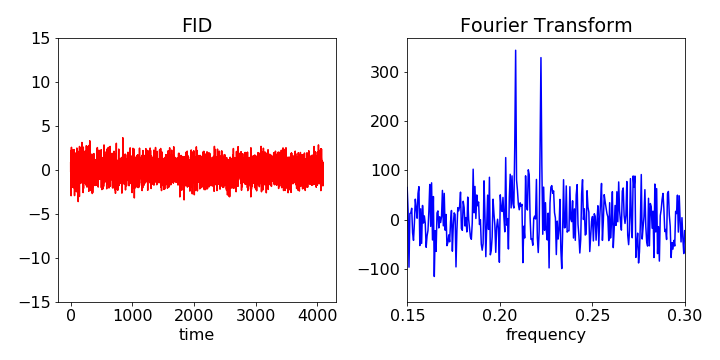
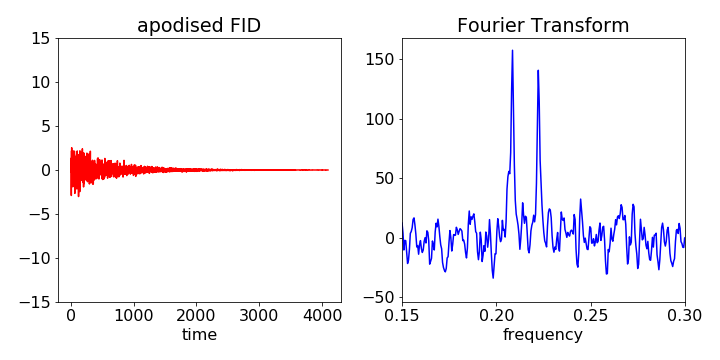
Key to the process is an understanding of how the raw data is preprocessed using a Hamming apodization function before spectral fitting.
Step 1: Hamming apodization function is applied to PFS interferograms. It is common practice in Fourier transform spectroscopy to multiply the measured interferogram by an apodizing function in order to reduce the amount of ringing present in the resulting instrumental line shape [77]. This reduces the spectral resolution a bit (from 1.3 cm-1 to 1.8 cm-1 in the case of PFS [78]), but also reduces the instrumental noise and the magnitude of the side-lobes in the instrumental line shape, which are a direct result of the finite maximum optical difference in the measured interferograms [79]. The Hamming function H is defined as H(δ/L) = 0.54+0.46cos(πδ/L), where δ is the optical path difference out to a maximum value of L.
- Davis, S. P., Abrams, M. C. & Brault, J. W., Fourier Transform Spectrometry, Academic Press (2001).
- Giuranna, M., et al., Calibration of the Planetary Fourier Spectrometer short wavelength channel. Planet. Space Sci. 53 (10), 975–991 (2005).
- Naylor, D.A. & Tahic, M. K., Apodizing functions for Fourier transform spectroscopy. J. Opt. Soc. Am. A 24, 3644–3648 (2007).
I was surprised to read that raw data is filtered before fitting to spectroscopic models in order to extract concentrations. I'm not an FTIRer, but I would have instead expected that all instrumental errors would be included in the fitted theoretical spectra generation and that the raw data would be fit in its pristine, unaltered form. After all, the only thing you really know for sure when fitting is that the data is the data, it's what you actually measured. Everything else is speculation.
QUESTION: Assuming that the block quote is right and it is indeed "common practice in Fourier transform spectroscopy to multiply the measured interferogram by an apodizing function in order to reduce the amount of ringing present in the resulting instrumental line shape" why is this considered "safe" to do? Why aren't all instrumental effects incorporated into the fitting function allowing for the raw data to be fit directly instead?
The spectra in question, from Independent confirmation of a methane spike on Mars and a source region east of Gale Crater:


