3
$\begingroup$

Consider the following molecule and data:

alkane

$$ \begin{align} \mathrm{H_a} &= \pu{1.0 ppm} &\quad J_\mathrm{ab} &= \pu{5.0 Hz}\\ \mathrm{H_b} &= \pu{3.0 ppm} &\quad J_\mathrm{bc} &= \pu{8.0 Hz}\\ \mathrm{H_c} &= \pu{6.0 ppm} &\quad J_\mathrm{ac} &= \pu{1.0 Hz}\\ \end{align} $$

Draw a splitting diagram for $\mathrm{H_b}.$ $(\pu{1 box} = \pu{1 Hz})$

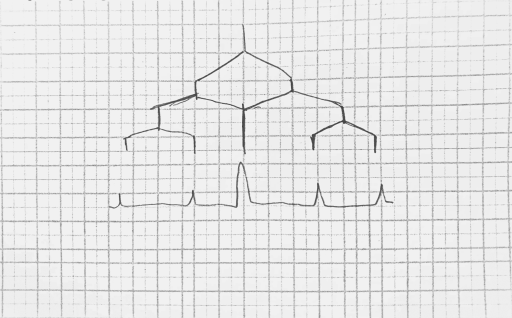
Tried to draw the splitting diagram and ended up with this diagram:

My splitting diagram

I am also stuck as to how to draw the spectrum of the whole molecule as I feel $\mathrm{H_a}$ would be triplet of triplet. Am I on the right track and how to draw the sketch of the spectrum?

$\endgroup$
1
  • 1
    $\begingroup$ You missed a split. The central peak must also split on the last coupling. $\endgroup$
    – Jan
    Commented Oct 15, 2019 at 8:28

1 Answer 1

3
$\begingroup$

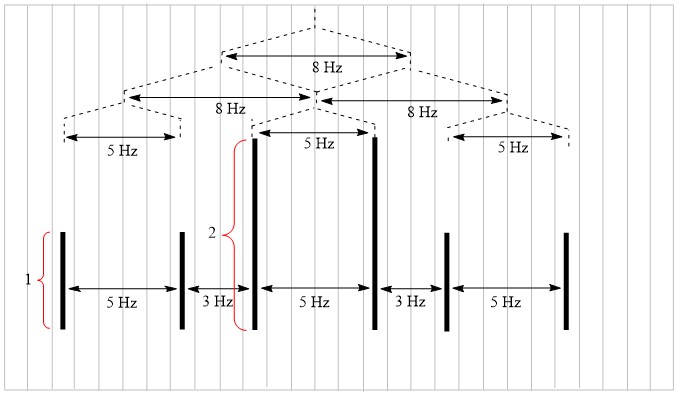
According to given data, you may consider expected peak patterns are not complicated such as $\mathrm{ABX}$ or $\mathrm{A_2B}$ patterns (more reading look here. This is simply a $\mathrm{A_2X}$ pattern ($\delta_X = \pu{6 ppm}$ and $\delta_A = \pu{1 ppm}$ without geminal coupling of two $\ce{H_b}$ protons), and hence, peak is a $dt$ for $\ce{H_b}$ as depicted below with relative heights of the peaks:

Hb peak

Similarly, $\ce{H_c}$ is also a $dt$ resonance with $J = 1 \text{ & } \pu{8 Hz}$ and $\ce{H_a}$ is a $tt$ with $J = 1 \text{ & } \pu{5 Hz}$. OP should able to figure out the intensities of relevant peaks.

A valuable reference:

Roy H. Bible, Jr., Ph.D., In Interpretation of NMR Spectra: An Empirical Approach; Springer Science: New York, NY, 1965 (https://doi.org/10.1007/978-1-4684-8288-1) (Note: Most relavent to this question is chapter 4 of the book titled "Higher-Order Spin Patterns and Multiple Resonance").

$\endgroup$
0

Your Answer

By clicking “Post Your Answer”, you agree to our terms of service and acknowledge you have read our privacy policy.

Not the answer you're looking for? Browse other questions tagged or ask your own question.