In a recent question it was explained that Gaussian window functions are not used in 2D NMR spectra as they can introduce artifacts into the spectrum baseline by truncating the FID. Why then are they used with 1D spectra instead of sin or cosine functions?
1 Answer
Under the conditions you measure a plain 1D proton spectrum, you usually never have any roblems with truncation of the FID. You have a relatively long relaxation delay, you don't gain anything by making your acquisition time much shorter than it can be. So a default setup might measure 64k or even 128k points, which is far, far larger than the values you use in 2D NMR.
In two-dimensional spectra there are several aspects that severely limit the number of points you measure:
Measuring more points in the indirect dimension takes time, if you want twice the points you have to measure twice as long. For that reason you only measure as much points in the indirect dimension as you have to, no more.
Processing can become a bit slow and take quite a bit of space when you increase the number of points in the direct dimension in a 2D spectrum. It's not a big problem with current hardware, but with a 3D (or higher) spectrum this gets much, much worse.
If you need to decouple during acquisition time, the acquisition time is severely limited by the probe hardware and heating effects of the decoupling.
So a typical 1D spectrum will have a lot more points measured, beyond the point where the FID has decayed below the noise. In such a case you won't get any truncation artifacts, as the FID was never truncated to begin with. You only need to worry about truncation artifacts if you actually truncate the FID.
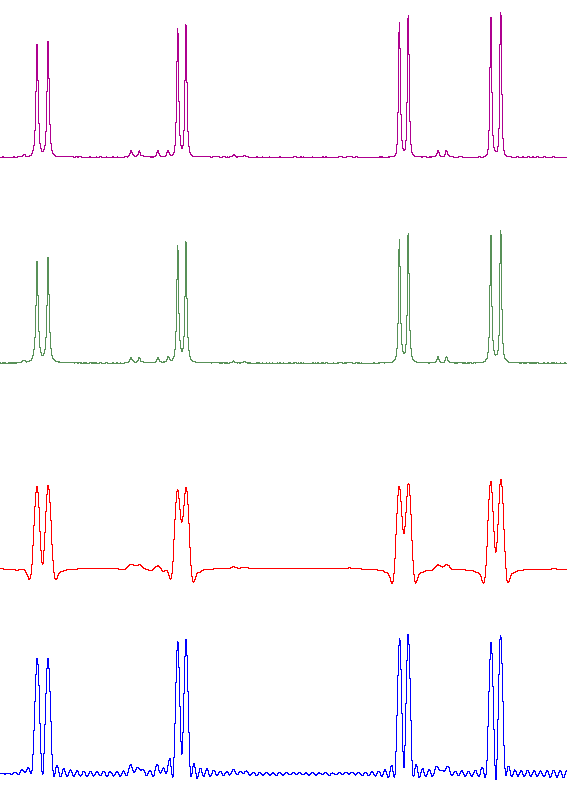
In the following image you can see
- lila: QSINE (SSB 4) 10k points in FID
- green: GM (LB -1, GB 0.5) 10k points in FID
- red: QSINE (SSB 4) 2k points in FID
- blue: GM (LB -1, GB 0.5) 2k points in FID

You can clearly see the truncation artifacts in the gaussian-processed spectra with 2k points, but already at 10k points they are not visible anymore. The quadratic cosine of the truncated FID doesn't look all that nice, but it suppresses the truncation artifacts much better than the gaussian window function.
The SSB 4 I used for this example is also a far more aggressive setting than I'd usually use. I chose it because it gives a relatively similar resolution as the gaussian I compared it to. Usually I'd use SSB 2 for most 2D spectra, which emphasizes signal/noise over resolution.
-
$\begingroup$ Now I want to add a question asking what the heck the QSINE window function does. I'm quite annoyed that none of the spectroscopy textbooks I've read go into this, when it is one of the easiest parameters to fiddle with. $\endgroup$– CanageekCommented Jul 27, 2012 at 19:44
-
$\begingroup$ @Canageek The Bruker Processing manual contains the exact formula of that one $\endgroup$ Commented Jul 27, 2012 at 19:49
-
$\begingroup$ Yeah, but I'm not good enough to tell what it does or why from the math. $\endgroup$– CanageekCommented Jul 28, 2012 at 21:27
