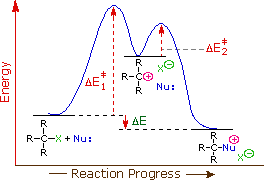
Yes, that diagram would be correct for the generic reaction. However in the specific case of an SN1 reaction the intermediate is almost always higher in energy than the reactants or the products, as they usually involve a carbocation. It is also typical of SN1 reactions for the first step to be rate-limiting, as carbocation formation from a neutral reactant is thermodynamically unfavorable unless specific reaction conditions are present. The three general rules for reaction coordinate diagrams are as follows:
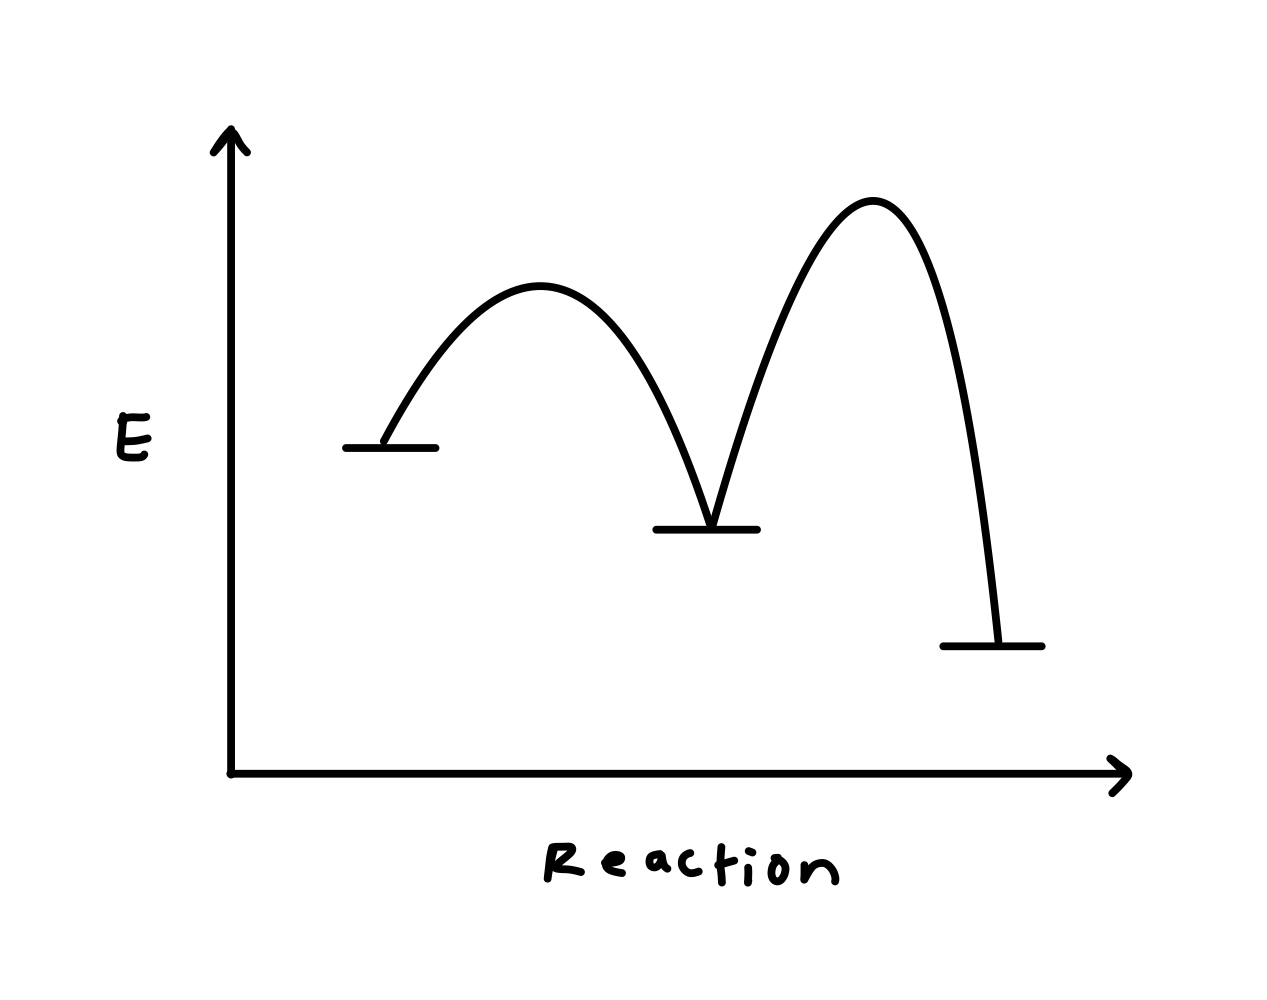
The number of “peaks” should be equal to the number of steps in the reaction.
The height of each peak relative to the valley to its left is representative of the activation energy of that step. Larger vertical distance between peaks = greater activation energy = slower step. The rate-limiting step of any reaction will have the greatest distance between its peak and the valley preceding it.
The height difference between your reactant(s) and product(s) is equal to your total change in enthalpy (delta H) for the reaction. If the products are below the reactants then enthalpy change will be negative, and the reaction is exothermic. The inverse is true of endothermic reactions.
It may be worth clarifying that this diagram is supposed to represent an SN1 mechanism and the second step is rate-limiting. The diagram of these reactions should look like this:

Hopefully this is helpful!


