0
$\begingroup$

I am a 12th grader. Recently, while revising the Periodic Table, I came across the statement:

As the effective nuclear charge increases across a period, the atomic radius of the elements decreases on moving from left to right in a period.

For some reason, I decided to fact-check this statement and compiled the atomic radii of the elements and graphed it. Unfortunately, I compiled the van der Waals' radii of the elements. Thus, while the graph I obtained did show the expected decreasing trend, it also showed sudden, unexpected fluctuations in the atomic radii (eg: boron, silicon).

My question is: why does the van der Waals' radius not obey the expected decreasing trend? Also, when we speak about the atomic radius, which is a better representative for this particular case: the covalent radius, or the van der Waals' radius?

I am attaching the graph I obtained for your reference: van der Waals' radii of the elements (in Å)
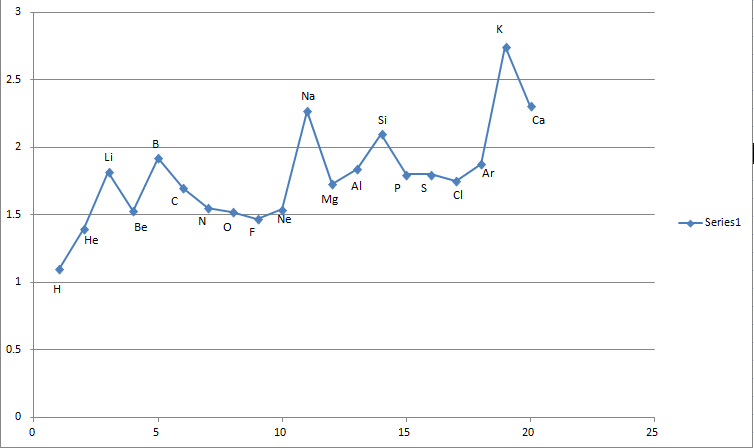
(van der Waals' radii of the elements (in Å))

$\endgroup$
2

1 Answer 1

2
$\begingroup$

Atomic radii are measured in many different ways—van der Waals radii do not capture precisely the same trends as it is calculated primarily (although not exclusively) from applying the van der Waals equation to gaseous systems and approximating the molecules as spheres. Spikes when moving from the s-block to the p-block are expected (e.g. Be $\rightarrow$ B) even in standard atomic radii maps because the p-orbital is large in size and repels away from the shielding electrons. However, when you define atomic radii based instead on the intensity of the electron cloud at certain distances from the nucleus, the trend with effective nuclear charge is maintained (i.e. the silicon issue goes away even if its van der Waal radius is anomalous).

$\endgroup$

Your Answer

By clicking “Post Your Answer”, you agree to our terms of service and acknowledge you have read our privacy policy.

Not the answer you're looking for? Browse other questions tagged or ask your own question.