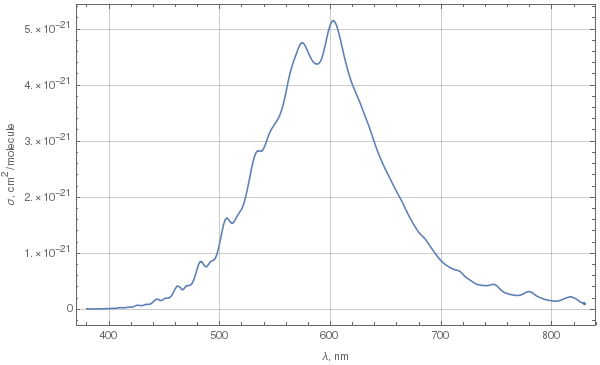
Due to Chappuis absorption, ozone does have a bluish color. To determine exactly what kind of blue it is, let's first look at the spectrum of absorption in the Chappuis band. The following plot was done using these data for 293K.

This is spectral cross-section of absorption. To determine color from this spectrum, we need to choose some parameters:
- Number density of ozone molecules,
- Thickness of ozone layer we're trying to visualize,
- Illuminant.
If we denote spectral radiance of our illuminant as $L(\lambda)$, thickness of ozone layer as $d$, ozone molecule number density as $\rho$, and absorption cross-section as $\sigma(\lambda)$, then we'll get the following expression for spectral radiance transmitted through the layer:
$$L_T(\lambda)=L(\lambda)\exp\big(-\sigma(\lambda)\rho d\big).$$
The most sensible illuminant to choose for showing color of a material on the web is the CIE illuminant D65, whose color is the white point of the sRGB color space. Its spectrum can be found e.g. here.
We can find the color in XYZ space using CIE 1931 color matching functions (can be found e.g. here). The expression is
$$c_X=\int_{300}^{830}L_T(\lambda)\bar x(\lambda)\,\mathrm d\lambda,$$
and similarly for $Y$ and $Z$ coordinates. Then these can be transformed to sRGB using linear transformation matrix $\mathrm{XYZ}\to\mathrm{sRGB}$ given e.g. here and gamma-correcting to $\gamma=1/2.2$ to yield final sRGB values.
Then, for ozone molecule number density $\rho=10^{25} \frac{\mathrm{molecule}}{\mathrm{m}^3}$ we'll get the following colors for different layer thicknesses:

For comparison, typical ozone column in the atmospheric ozone layer is about 300 Dobson units, which is equivalent to $2.687\times10^{20}\frac{\mathrm{molecule}}{\mathrm m^2}$; with our $\rho$ chosen above this corresponds to $d=8\,\mathrm{mm}$. So for daylight, ozone column has negligible effect on the sky color (unlike the evening — see the history of Chappuis absorption!).
As can be seen in the above plot, hue does change with increasing layer thickness. If we normalize the RGB values to see the hues of the thick layers (this would correspond to increasing illuminant power to compensate for absorption), we'll get the following hues:

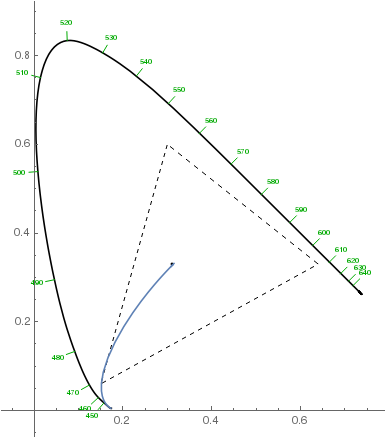
Note that the violet hues in the above plot aren't accurate: they can't be accurately represented on sRGB monitors, so the plot only approximates them. They should be more saturated. Here's how the chromaticity changes from the white point to the most violet with increasing layer thickness (dashed triangle denotes the sRGB gamut):

 (source)


