3
$\begingroup$

Consider the following reactions:

$$\begin{align}\ce{C + O2&->CO2}\tag{1}\\[1em] \ce{2C + O2&->2CO}\tag{2}\\[1em] \ce{2CO + O2&->2CO2}\tag{3}\\[1.5em] [(2)+(3)]/2 &= (1)\end{align}$$

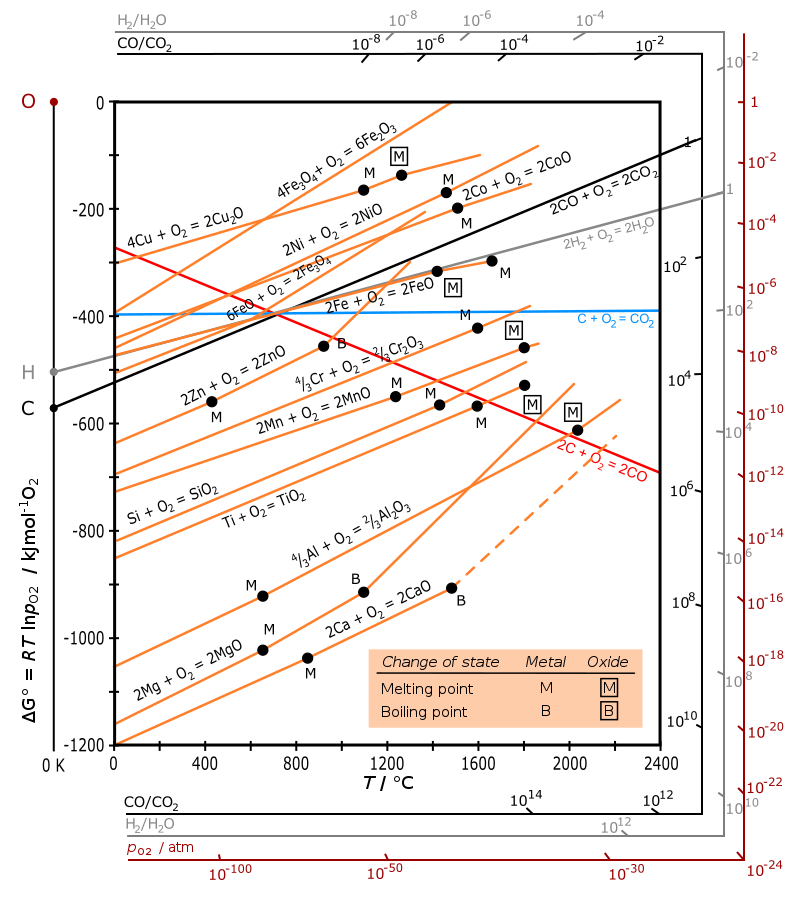
Ellingham Diagram for Carbon

Since $G$ is a state function, why aren't the straight lines corresponding to these reactions in the Ellingham diagram concurrent?

I have checked the graph from other sites but found none to be concurrent. Is there some kind of error in data or extrapolation of the graphs or any other specific reason for this?

$\endgroup$
10
  • 1
    $\begingroup$ $\Delta G$ is not a state function, $G$ is a state function. $\endgroup$
    – V.G
    Commented Jan 28, 2021 at 6:48
  • $\begingroup$ I was asking for the reason why the lines aren't concurrent $\endgroup$
    – Govind
    Commented Jan 28, 2021 at 17:41
  • 1
    $\begingroup$ If we write ∆G for 2nd and 3rd rxn and add the two, it should have a value twice as for 1st. $\endgroup$
    – Govind
    Commented Jan 28, 2021 at 18:12
  • 2
    $\begingroup$ So all the points on graph of 1st should be the midpoint of the corresponding points on graph of 2nd and 3rd $\endgroup$
    – Govind
    Commented Jan 28, 2021 at 18:15
  • 3
    $\begingroup$ Why has this question received downvotes? It's a reasonable question ,right? $\endgroup$
    – user102687
    Commented Jan 29, 2021 at 4:46

2 Answers 2

2
$\begingroup$

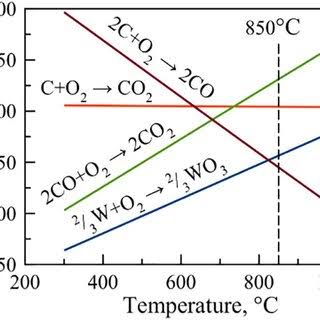
You are indeed right, I confirmed that it is the fault in the diagram itself. See the diagram by wikipedia:

enter image description here

$\endgroup$
0
$\begingroup$

Whether the lines are exactly concurrent depends on how the data were obtained. In the case of carbon oxidation, if we draw on measured thermodynamic data for oxidizing $\ce{CO}$ to $\ce{CO2}$ and also for oxidizing $\ce{C}$ to $\ce{CO2}$, then we could calculate the "data" for oxidizing $\ce{C}$ to $\ce{CO}$ by doubling the first reaction and subtracting the second (assuming all reactions are based on one mole of oxygen, which is standard for Ellingham diagrams), in which case the three lines are forced to be concurrent.

But if we draw on independent measurements for all three reactions and they are all subject to experimental errors, the errors may not combine mathematically in the same way as the theoretical reaction stoichiometries. The error (per mole of oxygen) that occurred when $\ce{C}$ was oxidized to $\ce{CO}$ may not be exactly twice the $\ce{C/CO2}$ error minus the $\ce{CO/CO2}$, in which case the three independently determined free energy lines would also not match up. If all three experiments had a similar amount of experimental error, then the deviation from concurrency in the diagram would provide a rough measure of this error. So having the lines not meet exactly could actually provide an additional bit of information behind the data.

$\endgroup$

Not the answer you're looking for? Browse other questions tagged or ask your own question.