Post Closed as "Needs details or clarity" by Jon Custer, Mathew Mahindaratne, Mithoron, Todd Minehardt, Waylander
Please do not use lab jargon and abbreviations, try to be inclusive for all, especially those with english as another language.
Source Link

Consider the following rxnsreactions:

$$\begin{align}\ce{C + O2&->CO2}\tag{1}\\[1em] \ce{2C + O2&->2CO}\tag{2}\\[1em] \ce{2CO + O2&->2CO2}\tag{3}\\[1.5em] [(2)+(3)]/2 &= (1)\end{align}$$

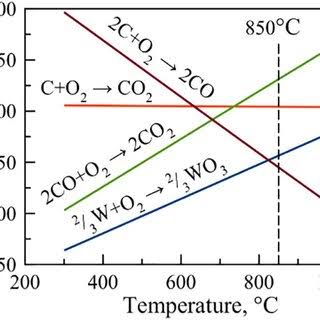
Ellingham Diagram for Carbon

Since $G$ is a state function, why aren't the straight lines corresponding to these reactions in the Ellingham diagram concurrent?

I have checked the graph from other sites but found none to be concurrent. Is there some kind of error in data or extrapolation of the graphs or any other specific reason for this?

Consider the following rxns:

$$\begin{align}\ce{C + O2&->CO2}\tag{1}\\[1em] \ce{2C + O2&->2CO}\tag{2}\\[1em] \ce{2CO + O2&->2CO2}\tag{3}\\[1.5em] [(2)+(3)]/2 &= (1)\end{align}$$

Ellingham Diagram for Carbon

Since $G$ is a state function, why aren't the straight lines corresponding to these reactions in the Ellingham diagram concurrent?

I have checked the graph from other sites but found none to be concurrent. Is there some kind of error in data or extrapolation of the graphs or any other specific reason for this?

Consider the following reactions:

$$\begin{align}\ce{C + O2&->CO2}\tag{1}\\[1em] \ce{2C + O2&->2CO}\tag{2}\\[1em] \ce{2CO + O2&->2CO2}\tag{3}\\[1.5em] [(2)+(3)]/2 &= (1)\end{align}$$

Ellingham Diagram for Carbon

Since $G$ is a state function, why aren't the straight lines corresponding to these reactions in the Ellingham diagram concurrent?

I have checked the graph from other sites but found none to be concurrent. Is there some kind of error in data or extrapolation of the graphs or any other specific reason for this?

Fixed MathJax, improved grammar and syntax slightly
Source Link
Jan
  • 68.7k
  • 12
  • 205
  • 389

Consider the following rxns:

  1. $\ce{C + O2->CO2}$
  2. $\ce{2C + O2->2CO}$
  3. $\ce{2CO + O2->2CO2}$

$[(2)+(3)]\div2$ yields $(1)$$$\begin{align}\ce{C + O2&->CO2}\tag{1}\\[1em] \ce{2C + O2&->2CO}\tag{2}\\[1em] \ce{2CO + O2&->2CO2}\tag{3}\\[1.5em] [(2)+(3)]/2 &= (1)\end{align}$$

Ellingham Diagram for Carbon

Since G$G$ is a state function so, why don'taren't the straight lines corresponding to these rxnsreactions in the ellingham Diagram areEllingham diagram concurrent?

I have checked the graph from other sites but found none to be concurrent. Is there some kind of error in data or extrapolation of the graphs or any other specific reason for this?

Consider the following rxns:

  1. $\ce{C + O2->CO2}$
  2. $\ce{2C + O2->2CO}$
  3. $\ce{2CO + O2->2CO2}$

$[(2)+(3)]\div2$ yields $(1)$

Ellingham Diagram for Carbon

Since G is a state function so why don't the straight lines corresponding these rxns in the ellingham Diagram are concurrent?

I have checked the graph from other sites but found none to be concurrent. Is there some kind of error in data or extrapolation of the graphs or any other specific reason for this?

Consider the following rxns:

$$\begin{align}\ce{C + O2&->CO2}\tag{1}\\[1em] \ce{2C + O2&->2CO}\tag{2}\\[1em] \ce{2CO + O2&->2CO2}\tag{3}\\[1.5em] [(2)+(3)]/2 &= (1)\end{align}$$

Ellingham Diagram for Carbon

Since $G$ is a state function, why aren't the straight lines corresponding to these reactions in the Ellingham diagram concurrent?

I have checked the graph from other sites but found none to be concurrent. Is there some kind of error in data or extrapolation of the graphs or any other specific reason for this?

Added more information
Source Link
Govind
  • 318
  • 1
  • 10

Consider the following rxns:

  1. $\ce{C + O2->CO2}$
  2. $\ce{2C + O2->2CO}$
  3. $\ce{2CO + O2->2CO2}$

$[(2)+(3)]\div2$ yields $(1)$

Ellingham Diagram for Carbon

Since ∆GG is a state function so why don't the straight lines corresponding these rxns in the ellingham Diagram intersect at a pointare concurrent?

I have checked the graph from other sites but found none to be concurrent. Is there some kind of error in data or extrapolation of the graphs or any other specific reason for this?

Consider the following rxns:

  1. $\ce{C + O2->CO2}$
  2. $\ce{2C + O2->2CO}$
  3. $\ce{2CO + O2->2CO2}$

$[(2)+(3)]\div2$ yields $(1)$

Since ∆G is a state function so why don't the straight lines corresponding these rxns in the ellingham Diagram intersect at a point?

Consider the following rxns:

  1. $\ce{C + O2->CO2}$
  2. $\ce{2C + O2->2CO}$
  3. $\ce{2CO + O2->2CO2}$

$[(2)+(3)]\div2$ yields $(1)$

Ellingham Diagram for Carbon

Since G is a state function so why don't the straight lines corresponding these rxns in the ellingham Diagram are concurrent?

I have checked the graph from other sites but found none to be concurrent. Is there some kind of error in data or extrapolation of the graphs or any other specific reason for this?

Source Link
Govind
  • 318
  • 1
  • 10
Loading