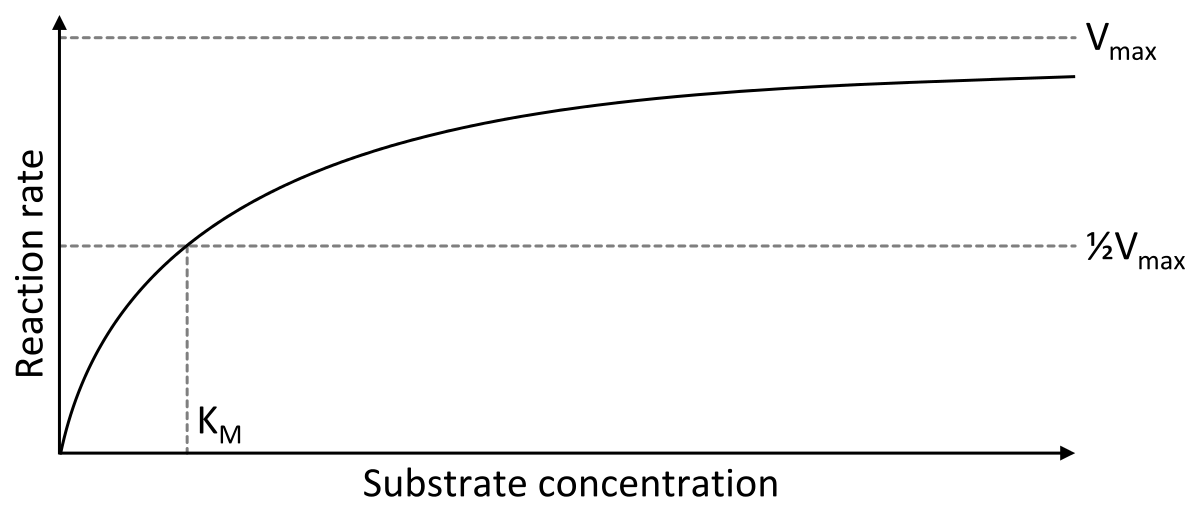
The curve is not hyperbolic. A hyperbolic curve is a result of an equation $f(x)=\dfrac{b}{a}\sqrt{x^2-a^2}$. Which is not the case here.
The enzyme catalysis (Michaelis-Menten model) can be described by the two step reaction.
$$\ce{E + S<=>[k_f][k_r] ES ->[k_{cat}] E + P}$$
In Michaelis-Menten kinetics you make either of the two approximations:
Equilibrium approximation: assuming that first reaction (i.e. enzyme-substrate binding) is in equilibrium. Therefore $k_r[ES]=k_f[E][S]$
Quasi-steady-state approximation (QSS): assuming that the concentration of $ES$ complex remains constant over time. Therefore $k_f[E][S]=(k_r+k_{cat})[ES]$
For both these cases you can substitute $[ES]$ with $[E_0]-[E]$ where $E_0$ is the total enzyme concentration. You can also represent $[E]$ in terms of $[S]$ using any of the above relationship. Then, you assume that maximum catalytic activity would be when all the available enzyme is complexed with the substrate ($[ES]=[E_0]$). In that case the maximum rate of catalysis $V_{max}$ would be $k_{cat}[E_0]$. When you put everything together then the rate of catalysis would turn out to be:
$$\frac{d[P]}{dt}=V_{max}\frac{[S]}{K_M+[S]}$$
Where:
These kind of curves denote saturation kinetics and can also be seen in case of adsorption.

