5
$\begingroup$

I've been trying to reproduce Figure 2 from this research paper (full text available).

The Problem

However I can't seem to get the same values as in the paper. I did the math both by hand and with MATLAB, but neither matched their results. I have the approximate solution (as it's from a graph) but after entering all the data and checking multiple times I still haven't been able to find what is wrong. The source for the graph/equation is the article at this link: The chemistry of co-injected BOE. The graph I want to reproduce is their Figure 2:
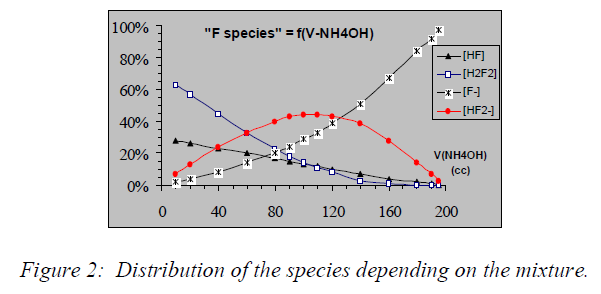
Graph of fraction of species from article

Above the figure it says: "distribution of the different species in a solution using $1800\,\mathrm{cc}$ of DI water, $100\,\mathrm{cc}$ of $49\%$ w/w HF and $0$ to $200\,\mathrm{cc}$ of $28\%$ w/w $\ce{NH4OH}$."

Here are the results I get for $10\,\mathrm{cc}$, $40\,\mathrm{cc}$ and $90\,\mathrm{cc}$:

$$ \begin{array}{c|cccc} \hline \text{Volume (cc)} & \ce{HF} & \ce{H2F2} & \ce{F-} & \ce{HF2-} \\ \hline 10 & 43\% & 48\% & 3\% & 6\% \\ 40 & 35\% & 33\% & 14\% & 18\% \\ 90 & 21\% & 12\% & 37\% & 30\% \\ \hline \end{array} $$

To calculate the fractions, I'm summing $\ce{HF}$, $\ce{H2F2}$, $\ce{F-}$ and $\ce{HF2-}$ to get the total and then I divide each of them by the total (both concentration and moles should both be valid).

I was wondering if anyone might have an idea of what I might be doing wrong. Or if the graph in the paper might possibly have an error or if there's some other numeric error in the paper.

Originally, I thought something was wrong with MATLAB's solution but I've checked that so many times by now, in more than just the two ways I show down below, that I really feel that that's not the issue. I've been at this problem for a month now, and about a week into it (3 weeks ago) I asked for help with the MATLAB side of things (see post on SO of original problem; I had some friends help out in the end). Honestly I just really want to know what the problem/mistake is.

The Equations

The equations being used from the article are in the image below:
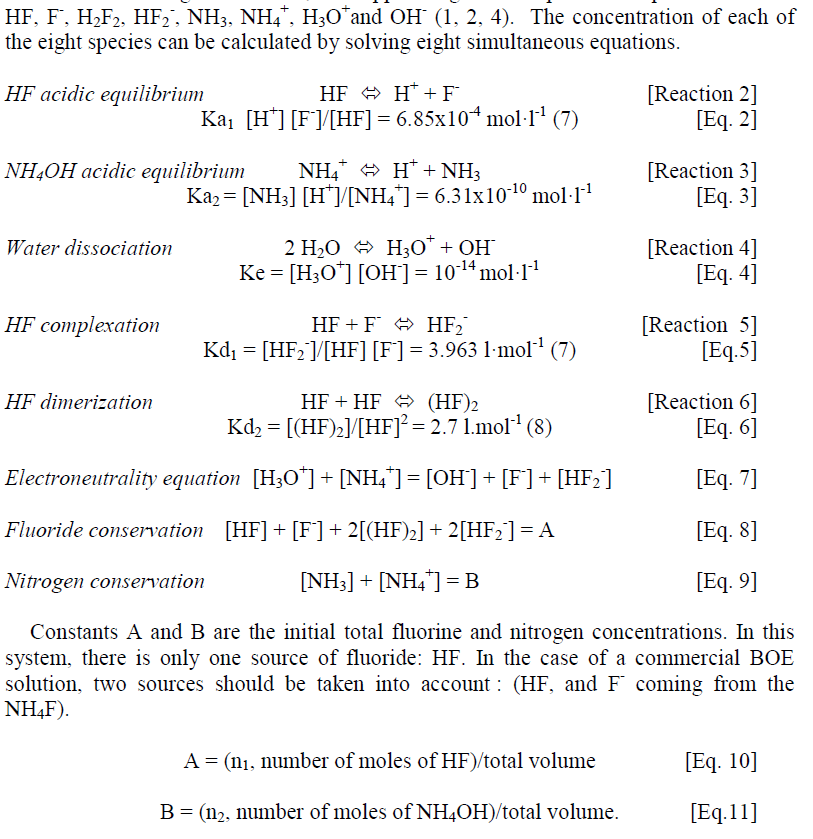
Equations from article

Matlab scripts used

The matlab scripts I used are the following:

First mols.m as a depency of the other two,

%%%% amount of mol, Vol=volume, d=density, pwt=%weight, M=molecularweight
function mol=mols(Vol, d, pwt, M)
mol=(Vol*d*pwt)/M;
end

First script, all matlab calculated

clc;
clear all;
%Units to be used 
%Volume is in CC also cm^3, 1 litre is 1000 CC, 1 cc = 1 ml
%density is in g/cm^3
%weigth percentages are in fractions of 0 to 1
%Molecular weight is in g/mol
% pts=10; %number of points for linear spacing

%weight percentages of NH4OH and HF
xhf=0.49;
xnh3=0.28;

%H2O
Vh2o=1800;
dh2o=1.00; %0.997 at 25C when rounded 1
mh2o=18.02;

%HF values
Vhf=100;
dhf49=1.15;
dhf=dh2o+(dhf49-dh2o)*xhf/0.49; %@ 25C
Mhf=20.01;
nhf=mols(Vhf,dhf,xhf,Mhf);

%NH4OH (NH3) values
% Vnh3=linspace(0.1*Vhf,1.9*Vhf,pts);
Vnh3=10;
dnh3=0.9; %for ~20-31% @~20-25C
Mnh3=17.03; %The wt% of NH4OH actually refers to the wt% of NH3 dissolved in H2O
nnh3=mols(Vnh3,dnh3,xnh3,Mnh3);

if max(nnh3)>=nhf
    error(['There are more mols NH4OH,',num2str(max(nnh3)),', than mols HF,',num2str(nhf),'.'])
end

%% Calculations for species 
Vt=(Vhf+Vh2o+Vnh3)/1000; %litre
A=nhf/Vt; %mol/l
B=nnh3/Vt; %mol/l
syms HF F H2F2 HF2 NH3 NH4 H OH
eq2= H*F/HF==6.85*10^(-4);
eq3= NH3*H/NH4==6.31*10^(-10);
eq4= H*OH==10^(-14);
eq5= HF2/(HF*F)==3.963;
eq6= H2F2/(HF^2)==2.7;
eq7= H+NH4==OH+F+HF2;
eq8= HF+F+2*H2F2+2*HF2==A;
eq9= NH3+NH4==B;
eqns=[eq2,eq5,eq6,eq8,eq4,eq3,eq9,eq7];
varias=[HF, F, H2F2, HF2, NH3, NH4, H, OH];
assume(HF> 0 & F>= 0 & H2F2>= 0 & HF2>= 0& NH3>= 0 & NH4>= 0 & H>= 0 & OH>= 0)
[HF, F, H2F2, HF2, NH3, NH4, H, OH]=vpasolve(eqns,varias);% [0 max([A,B])])

totalHF=double(HF)+double(F)+double(H2F2)+double(HF2);
HFf=double(HF)/totalHF %fraction of species for HF
H2F2f=double(H2F2)/totalHF %fraction of species for H2F2
Ff=double(F)/totalHF %fraction of species for F-
HF2f=double(HF2)/totalHF %fraction of species for HF2-

Second script, equation were written out and solved by hand until being left with the final equation which was then solved in matlab

clc;
close all;
clear all;
%Units to be used 
%Volume is in CC also cm^3, 1 litre is 1000 CC, 1 cc = 1 ml
%density is in g/cm^3
%weigth percentages are in fractions of 0 to 1
%Molecular weight is in g/mol
% pts=10; %number of points for linear spacing

%weight percentages of NH4OH and HF
xhf=0.49;
xnh3=0.28;

%H2O
Vh2o=1800;
dh2o=1.00; %0.997 at 25C when rounded 1
mh2o=18.02;

%HF values
Vhf=100;
dhf49=1.15;
dhf=dh2o+(dhf49-dh2o)*xhf/0.49; %@ 25C
Mhf=20.01;
nhf=mols(Vhf,dhf,xhf,Mhf);

%NH4OH (NH3) values
% Vnh3=linspace(0.1*Vhf,1.9*Vhf,pts);
Vnh3=10;
dnh3=0.9; %for ~20-31% @~20-25C
Mnh3=17.03; %The wt% of NH4OH actually refers to the wt% of NH3 dissolved in H2O
nnh3=mols(Vnh3,dnh3,xnh3,Mnh3);
if max(nnh3)>=nhf
    error(['There are more mols NH4OH,',num2str(max(nnh3)),', than mols HF,',num2str(nhf),'.'])
end

n2=nnh3;
n3=nhf-nnh3;

%% Calculations for species 
Vt=(Vhf+Vh2o+Vnh3)/1000; %litre
A=nhf/Vt; %mol/l
B=nnh3/Vt; %mol/l

syms H 
yl=H*(1+B/(H+6.31*1e-10));
HF=(sqrt((H+6.85*1e-4)^2+4*A*H*(H*5.4+5.42*1e-3))-(H+6.85*1e-4))/(2*(H*5.4+5.42*1e-3));
yr1=(1/H)*(1e-14+6.85*1e-4*HF*(1+3.963*HF));
hf=matlabFunction(yr1-yl);
H3O=fzero(hf, 6.23e-3)
yval=double(subs(yl,H,H3O))
yvalcheck=double(subs(yr1,H,H3O))

figure 
hold on 
bnds=[H3O-0.1 H3O+0.1 yval-0.1 yval+0.1];
ezplot(yl,bnds);
ezplot(yr1,bnds);
plot(H3O,yval,'or','MarkerSize',10,'LineWidth',2)

HF=double(subs(HF,H,H3O));
F=6.85*1e-4*HF/H3O;
HF2=3.963*HF*F;
H2F2=2.7*HF^2;

totalHF=HF+F+H2F2+HF2;
HFf=HF/totalHF %fraction of species for HF
H2F2f=H2F2/totalHF %fraction of species for H2F2
Ff=F/totalHF %fraction of species for F-
HF2f=HF2/totalHF %fraction of species for HF2-
$\endgroup$

1 Answer 1

9
+50
$\begingroup$

Your math and program(s) appear to be correct.

HOWEVER: The discrepancy between your calculation and that from the paper arises from different definitions of the fraction of each fluorine-containing species that is present.

You have calculated the fractions based on the total amount of each substance present; e.g.:

$$ \require{begingroup}\begingroup\newcommand{\conc}[1]{[\ce{#1}]}\newcommand{\Ka}[1]{K_{\mathrm a, \ce{#1}}}\newcommand{\Keq}[1]{K_{\ce{#1}}} f_\ce{F-} = {\conc{F-}\over \conc{F-} + \conc{HF} + \conc{HF2-} + \conc{(HF)2}} \\ f_\ce{HF2-} = {\conc{HF2-}\over \conc{F-} + \conc{HF} + \conc{HF2-} + \conc{(HF)2}} $$

In the paper, they have calculated these fractions based on the amount of fluorine atoms embodied by each substance present; e.g.:

$$ \hat f_{\!\ce{F-}} = {\conc{F-}\over \conc{F-} + \conc{HF} + 2 \conc{HF2-} + 2 \conc{(HF)2}} \\ \hat f_{\!\ce{HF2-}} = {2 \conc{HF2-}\over \conc{F-} + \conc{HF} + 2 \conc{HF2-} + 2 \conc{(HF)2}} $$

As I'll show, the former definition reproduces the results you provided in your question, and the latter reproduces the figure from the paper quite nicely.


I like to use Excel for equilibrium calculations—I find that being able to see the full sweep of the math at a glance helps me keep a grasp of where I'm at in the process of putting the solution together. Also, the Solver add-in makes it really easy to calculate results once the worksheet is assembled.

In the below, I've used the following color convention:

  • Purple: Reference data and given values from the problem
  • Gray: Calculated by formula
  • Orange: Input parameter
  • Blue: Parameter for Excel Solver
  • Green: Outputs for the Excel Solver objective function

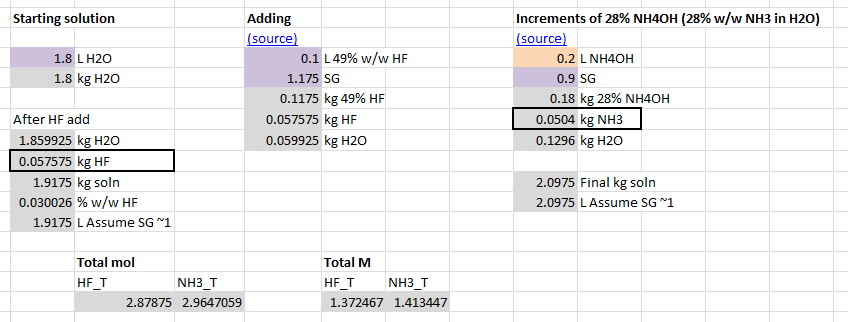
First, I set up the calculation for the composition and volume of the final mixture, with the volume of 28% ammonium hydroxide as a parameter:

Problem setup, calculating total F, N composition and solution volume

The specific gravities of the stock $\ce{HF}$ and $\ce{NH4OH}$ solutions were appreciably different from unity $(\ce{HF}$ source | $\ce{NH4OH}$ source$)$. After mixture into the $1.8\,\mathrm L$ of water, though I just assumed all $\ce{SG} = 1$. I tracked the masses of total $\ce{HF}$ and $\ce{NH3}$ $($since the 28% is presumably weight percent of $\ce{NH3})$ as well as the overall mass of the system all the way through. In combination with the relevant molecular weights, this allowed calculation of the total concentrations of fluorine and nitrogen species as well as the final volume of the system.

From here, I calculated the distribution of species in the final system:

Intermediate and final results of the speciation calculations

I took the system $\mathrm{pH}$ as an adjustable parameter for the Solver. From there, the $\ce{H+}$ and $\ce{OH-}$ concentrations are trivial to calculate. For simple acid-base equilibria, I like to formulate the calculation in terms of the ratio between the acid and base species:

$$ \Ka{NH4+} = {\conc{H+}\conc{NH3} \over \conc{NH4+}} \quad \Longrightarrow \quad \rho_\ce{NH4+} = {\conc{NH4+} \over \conc{NH3}} = {\conc{H+} \over \Ka{NH4+}} $$

In this case, where there is only the one acid-base equilibrium for the ammonia/-ium system, the concentrations can be calculated as:

$$ \conc{NH3} = {\conc{N_\mathrm{total}} \over 1 + \rho_\ce{NH4+}} ~ ; \quad \conc{NH4+} = \rho_\ce{NH4+} \conc{NH3} $$

Unlike in the reference linked in the question, I chose not to carry out the substitutions needed to express the concentrations of the fluorine-containing species solely in terms of $\conc{H3O+}$. Instead, I defined them as follows:

$$ {\conc{HF} \over \conc{F-}} = {\conc{H+} \over \Ka{HF}} \\ {\conc{HF2-} \over \conc{F-}} = \Keq{HF2-} \conc{HF} \\ {\conc{(HF)2} \over \conc{HF}} = \Keq{(HF)2} \conc{HF} $$

I then set up a guess for $\conc{F-}$ as an adjustable parameter for the solver (blue cell), and used the above ratios to calculate trial concentrations for the other three species (gray cells). The appropriately weighted sum of these concentrations $(1$ for $\conc{F-}$ and $\conc{HF}$; $2$ for $\conc{HF2-}$ and $\conc{(HF)2})$ was then matched against $\conc{F_\mathrm{total}}$ (green cell).

The species fractions in bold italics, which will be used in the charts below, were defined either as $f_i$ or $\hat f_{\!i}$, appropriately. Note that these values are not used in solving the system of equilibrium equations, so it didn't matter which one I had defined when I executed the Solver.

The charge balance was the final equation to set up, with no changes from that shown in the original question, except for pulling all the terms to one side so that the target value was zero.

I then set up the Solver add-in to find the best-fitting values for the $\mathrm{pH}$ and $\conc{F-}$:

View of solver, set up

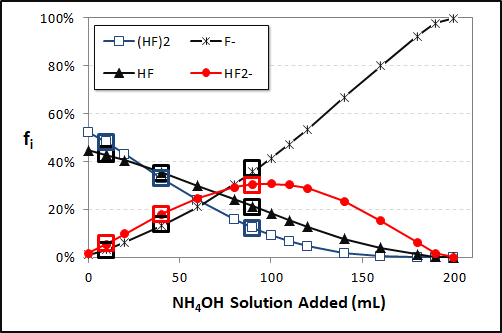
I ran through the set of relevant addition volumes of $\ce{NH4OH}$, from $0$ to $200\,\mathrm{mL}$, storing the values of all of the $f_i$ and $\hat f_{\!i}$ values for plotting. This is what I got for the fractions $f_i$:

Chart of predicted f_i concentrations

The heavy squares are the individual data points you provided in your question. As can be seen, they match the $f_i$ results quite well.

Here is the chart of the $\hat f_{\!i}$ values, which is a spot-on match to the one in the paper:

Chart of predicted f-hat_i concentrations$\endgroup$

$\endgroup$
6
  • $\begingroup$ Thank you so much I was wondering what I did wrong. This helps me out a lot as I can finally understand what I did wrong. I'm going to read through this properly when I have a bit more time and after that I'll accept it as the solution, for now I upvoted it. Thank you so much. $\endgroup$ Commented Jun 26, 2018 at 16:52
  • $\begingroup$ @BobvandeVoort Sure! Yeah, the key difference is absolutely between the definitions of $f_i$ and $\hat f_{\!i}$. $\endgroup$
    – hBy2Py
    Commented Jun 26, 2018 at 17:13
  • $\begingroup$ This explains it perferctly and again thank you. I'm just wondering if you would know one other thing maybe. Why would we look at the concentration based of fluorine atoms? I'm trying to take a good initial guess of the relative etching/dissolving/reaction speed between this chemical mix/soup and another material ($HfO_2$). $\endgroup$ Commented Jun 27, 2018 at 14:04
  • $\begingroup$ @BobvandeVoort I have no idea. For this application, calculating the distribution of species for a buffered oxide etch to estimate a rate of reaction, I wouldn't use either of the $f_i$ or $\hat f_{\!i}$ fractions. I'd just stick with the concentration values themselves. $\endgroup$
    – hBy2Py
    Commented Jun 27, 2018 at 14:23
  • 1
    $\begingroup$ @BobvandeVoort Though, I should say -- their choice of $\hat f_{\!i}$ does make sense in that it properly bookkeeps all of the initial fluoride added to the system with the 49% HF. (IOW, it makes sense to count $\ce{HF2-}$ and $\ce{(HF)_2}$ twice since they each have two fluorine atoms.) $\endgroup$
    – hBy2Py
    Commented Jun 28, 2018 at 2:51

Your Answer

By clicking “Post Your Answer”, you agree to our terms of service and acknowledge you have read our privacy policy.

Not the answer you're looking for? Browse other questions tagged or ask your own question.