The following is an addon to the existing answer.
Frost diagram is indeed a simple and intuitive visual aid helping to identify which oxidation states of an element are most stable in solution.
However, the textbook Frost diagrams, like the majority of thermodynamic data, are usually reported for 25 °C.
Since OP is asking about boiling hot solution, we need to compile the Frost diagram for that ourselves.
The standard reduction potentials alongside with their temperature coefficients $\mathrm dE^\circ/\mathrm dT$ have been collected and reported by Bratsch [1].
The temperature dependence of reduction potentials is approximately linear between
$\pu{0 °C}$ and $\pu{100 °C}:$
$$E^\circ_T = E^\circ_{298} + (T - 298.15)\left(\frac{\mathrm dE^\circ}{\mathrm dT}\right)_{298}$$
For the further reference I made a tableau with calculated $(\pu{60 °C}$ to $\pu{100 °C})$ potentials for the range of elevated temperatures for the half-reactions of interest:
\begin{array}{llrrrrr}
\hline
& \left(\frac{\mathrm dE^\circ}{\mathrm dT}\right)_{298} & & & & & \\
\text{Half-reaction} & /\pu{mV K^-1} & E^\circ_{298}/\pu{V} & E^\circ_{333}/\pu{V} & E^\circ_{343}/\pu{V} & E^\circ_{353}/\pu{V} & E^\circ_{363}/\pu{V} & E^\circ_{373}/\pu{V} \\
\hline
\ce{Cl2(g)}/\ce{Cl-} & -1.248 & 1.360 & 1.404 & 1.417 & 1.429 & 1.442 & 1.454 \\
\ce{ClO^-}/\ce{Cl2(g),OH-} & -0.90 & 0.420 & 0.389 & 0.380 & 0.371 & 0.362 & 0.353 \\
\ce{ClO2^-}/\ce{Cl^-,OH-} & -1.267 & 0.786 & 0.742 & 0.729 & 0.716 & 0.704 & 0.691 \\
\ce{ClO3-}/\ce{Cl2(g),OH-} & -1.35 & 0.465 & 0.418 & 0.404 & 0.391 & 0.377 & 0.364 \\
\ce{ClO4-}/\ce{Cl2(g),OH-} & -1.322 & 0.446 & 0.399 & 0.385 & 0.372 & 0.358 & 0.345 \\
\hline
\end{array}
Using this, one can make a Latimer diagram for the oxidation numbers (O.N.s) of interest, which I'm going to make in a tabular form for $\pu{25 °C}$ and $\pu{100 °C}:$
\begin{array}{rrr}
\hline
\text{O.N.} & E^\circ_{298}/\pu{V} & E^\circ_{373}/\pu{V} \\
\hline
-1 & -1.360 & -1.267 \\
0 & 0.000 & 0.000 \\
1 & 0.420 & 0.353 \\
3 & 2.146 & 1.958 \\
5 & 2.325 & 1.819 \\
7 & 3.122 & 2.413 \\
\hline
\end{array}
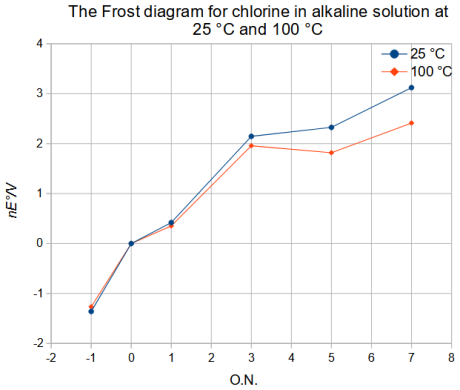
Plotting this data gives a Frost diagram for chlorine at room temperature and boiling hot solution.
Note a more pronounced local minimum for O.N. 5 for the hot solution, which implies tendency of both chlorite and perchlorate to comproportionate forming chlorate $\ce{ClO3-}$ as the more thermodynamically stable oxyanion.
Chlorite always lies above the line connecting two adjacent species and would tend to undergo disproportionation at room temperature and much faster (negative slope) in hot solution.

Reference
- Bratsch, S. G. Standard Electrode Potentials and Temperature Coefficients in Water at 298.15 K. J Phys Chem Ref Data 1989, 18 (1), 1–21. DOI: 10.1063/1.555839.


