11
$\begingroup$

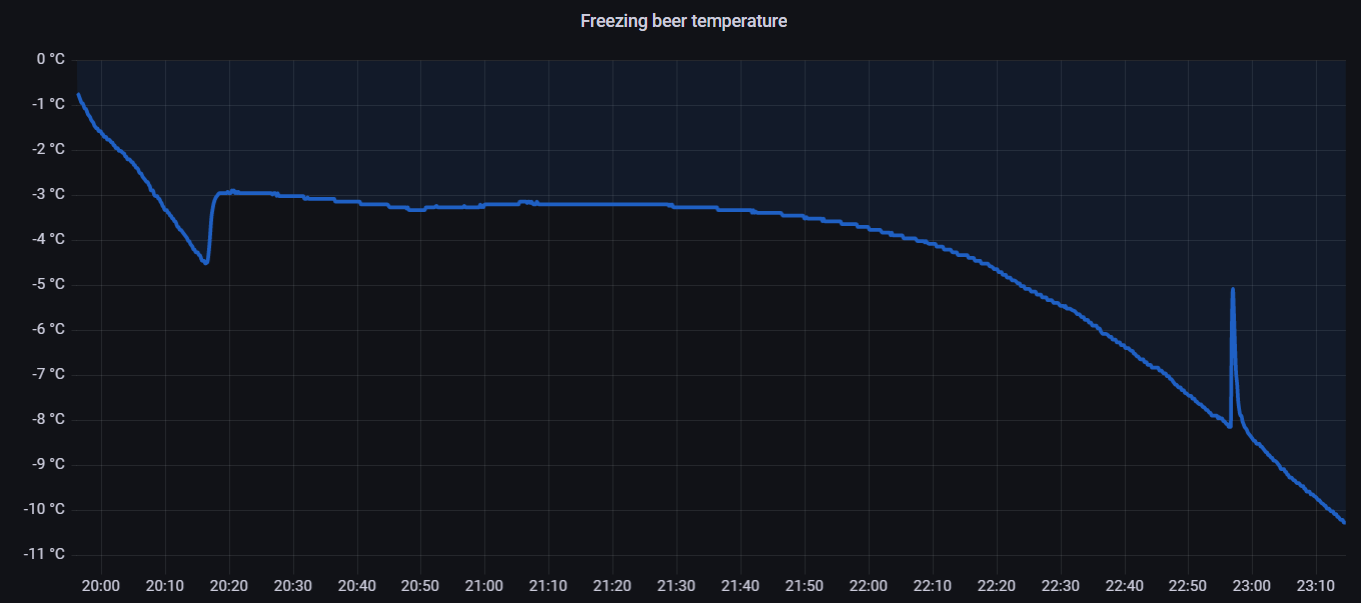
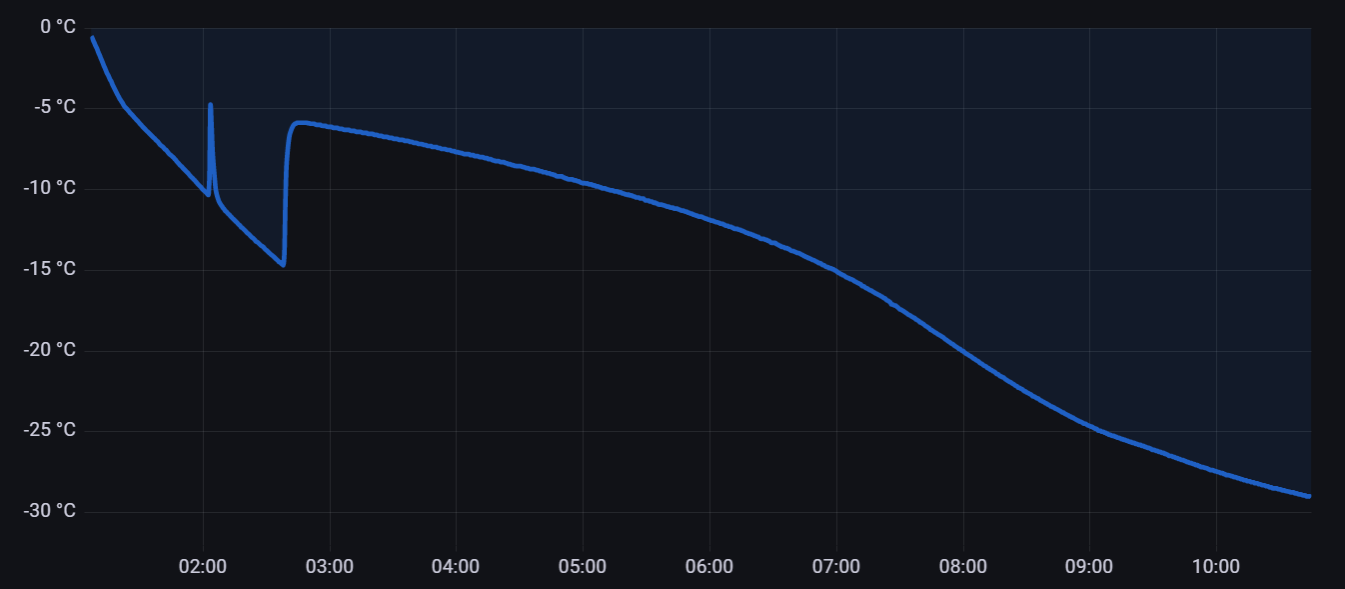
I left an open beer in the freezer while monitoring its temperature. The first minutes works as expected. But after the plateau, at about −8 °C, a peak appeared:

Beer freezing (open can)

I thought it was an artefact because the can was open and the sensor was inside.

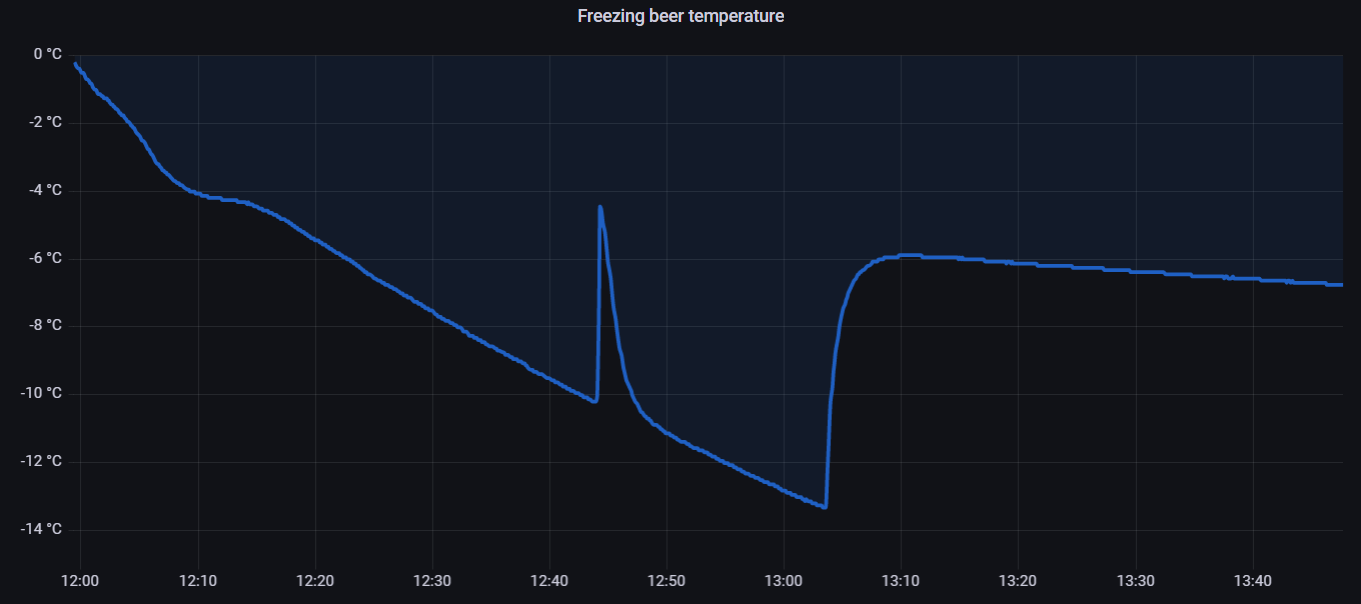
So I repeated the experiment with an intact, closed can.

Beer freezing (closed can)

The same spike occurs slightly below −10 °C. Well into the superfreezing phase, which is much wider this time.

Since beer is a liquid solution, I think this must be some component that changes phase before the others. Or maybe something related with solubility of $\ce{CO2}$ or ethanol as temperature changes.

Do you know what it is due to?

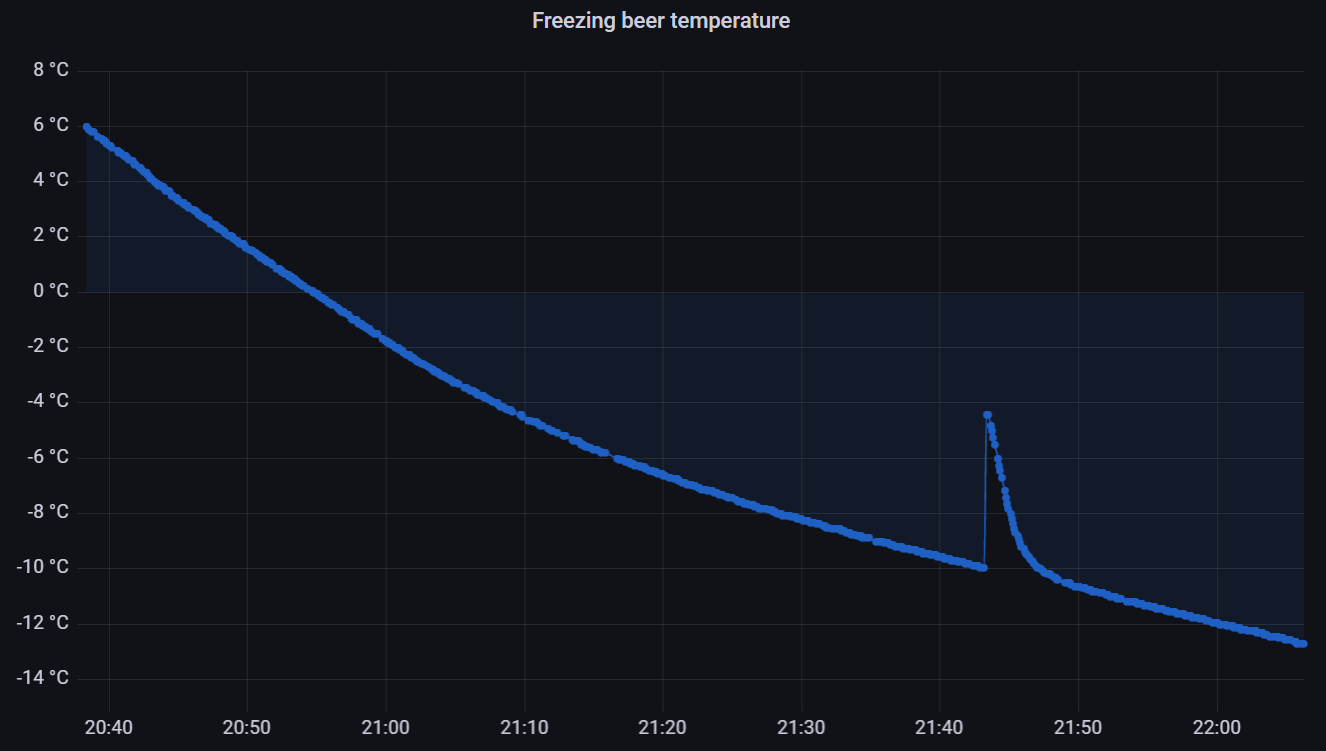
Update: reproducibility

After defrosting the can and putting it back in the freezer, the peak appeared again. Same result.

Beer freezing repeated experiment

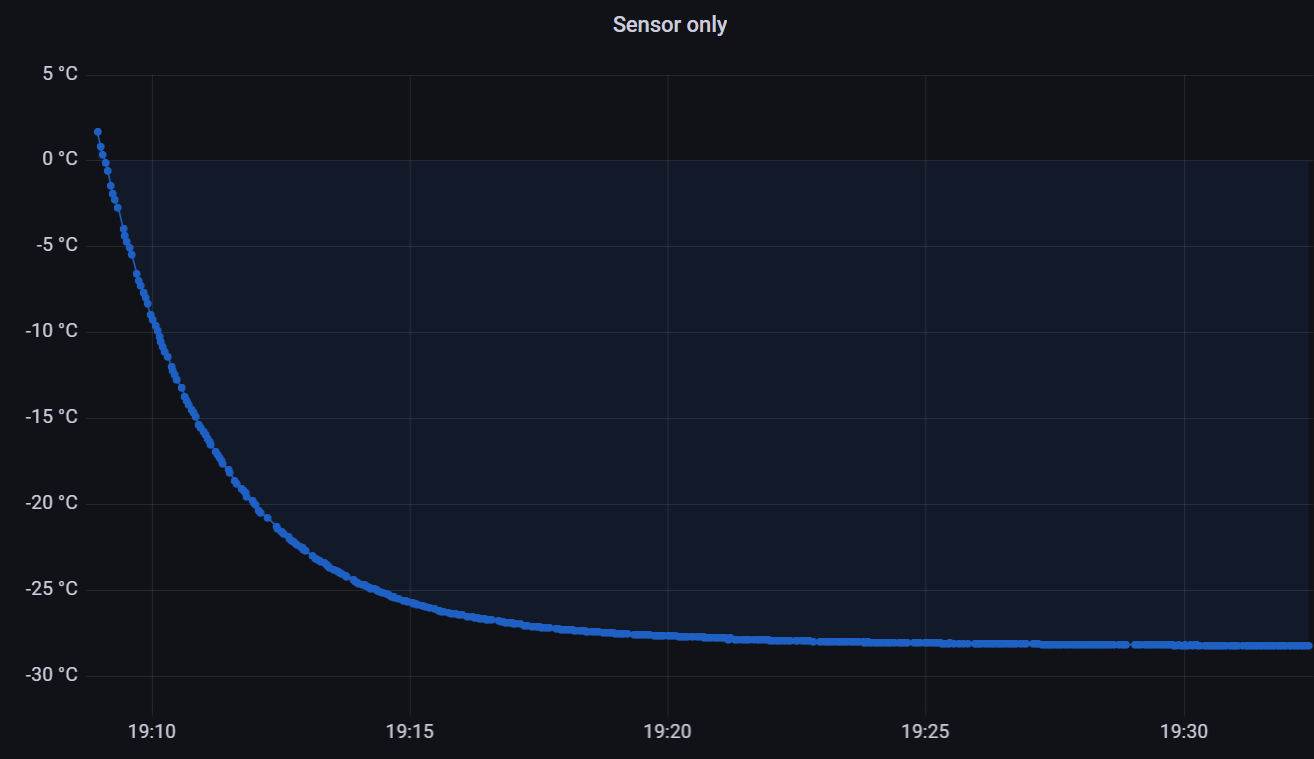
In order to discard a sensor issue, this is the freezing curve of the sensor itself:

freezing curve of the sensor itself

Curve of full freezing process:

Full freezing

$\endgroup$
6
  • $\begingroup$ What disturbs me is the peak sharpness and symmetry, giving a strong hint it may be an artefact. Try repeated measurement to test the peak location reproducibility, together with measurement of the open space T. $\endgroup$
    – Poutnik
    Commented Sep 4, 2021 at 14:51
  • $\begingroup$ Thank you @Poutnik. I reproduced the result and updated the question. I cannot measure the open space at the same time since I only have one sensor. But I don't find any reason why the freezer should suddenly increase 5ºC at this exact moment. $\endgroup$
    – EyC
    Commented Sep 4, 2021 at 20:39
  • $\begingroup$ It could be interesting to replicate experiment with plain and carbonated (open and closed) water. $\endgroup$
    – Poutnik
    Commented Sep 5, 2021 at 9:28
  • 2
    $\begingroup$ @Poutnik it might be an artefact after all. I dissasembled my setup and found condensation water in my temperature probe. That spike may be caused by the latent heat of that small amount of water phase-transitioning. I am repeating the experiment with a new probe. $\endgroup$
    – EyC
    Commented Sep 5, 2021 at 13:09
  • 1
    $\begingroup$ The strangest thing is the fact that the thin exothermic peak happens always at nearly the same temperature, -$9$°C or -$10$°C, independently from the end of the supercooled water, which happens sometimes at -$5$°C and sometimes at -$15$°C, as if it was the crystallization of a very small amount of an impurity in the beer. This crystallization is very different from the crystallization of supercooled water, which is responsible of the sudden and lasting increase of temperature observed in all curves at various temperatures (from -$5$°C to -$15$°C). $\endgroup$
    – Maurice
    Commented Sep 5, 2021 at 13:16

2 Answers 2

7
$\begingroup$

So it finally turned out to be an artefact, sorry.

The probe was protected by a small metallic tube. Somehow water condensed inside. Since this water is isolated from the main liquid, it performed its own phase-transition releasing its latent heat right next to the sensor.

The effect was not appreciated when freezing the probe alone. I don't know why, maybe because of a faster cooling o due to its physical position. But it was very noticeable when measuring the beer can.

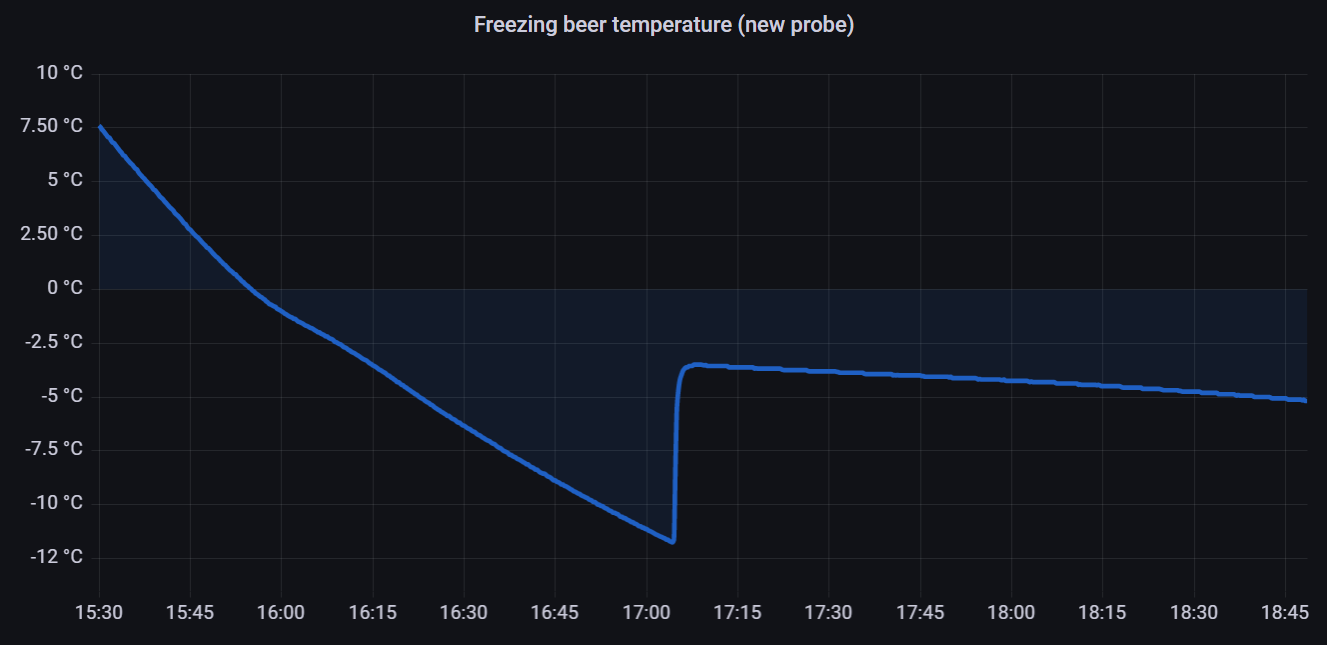
I removed the tube and cleaned the sensor. I also ensured the thermosensitive part is physically in contact with the can; and I insulated it better from the environment. Now the measurement is more accurate and no weird peaks.

Thank you all for your time.

Beer freezing, new setup

$\endgroup$
1
$\begingroup$

A nicely done experiment!

Consider hand-warmers containing sodium acetate trihydrate, $\ce{NaCH3COO.3H2O}$. When heated above the melting point and then cooled, the compound does not quickly solidify, but can be greatly supercooled. Given an impetus to begin crystallization, such as the shock-wave produced by a "clicker" (or nucleation by a speck of dust), the molecules reorganize from liquid to solid, giving off heat to warm your digits. The increased order of the solid frees up some energy.

In a similar way, when supercooled water freezes, it gives off heat. Your graph seems to show that effect.

To see it even more vividly, put distilled water in a polypropylene food container with lid on loosely. Boil the water in a microwave oven for just a few seconds to remove most dissolved air, which otherwise would nucleate freezing too early. Do not boil a second time, or the air-free water can superheat, and then flash into steam all at once, blowing open the microwave and blowing an internal fuse. [Lest you ask, yes, this happened to me - no burns, but I had to disassemble the oven to replace the fuse.]

Put your thermocouple on the outside of the container (or it, too, could nucleate freezing), and place all in a fairly cold freezer. Likely, the freezer will not be cold enough to freeze that water, and your cooling graph should be smooth. Now, take out the container and give it a sharp rap on a counter... watch the water, and observe the temperature change.

Of course, freezing beer drives out the bubbles, so I hope you don't mind flat beer. ;-)

$\endgroup$
6
  • $\begingroup$ Hmm, if it was freezing of supercooled beer, there would not be fast temperature return to previously achieved temperature. There would be reaching the freezing point, forming a plateau until bear is frozen. With some drift, as freezing point would not be constant with freezing progress. $\endgroup$
    – Poutnik
    Commented Sep 5, 2021 at 4:54
  • $\begingroup$ P.S.:The plateau like on the second picture of the original post. $\endgroup$
    – Poutnik
    Commented Sep 5, 2021 at 5:29
  • $\begingroup$ Thanks for your explanation. But I am not sure to understand the reason of a sharp peak in the middle of the process. Would you mind to clarify, please? $\endgroup$
    – EyC
    Commented Sep 5, 2021 at 8:57
  • $\begingroup$ @Poutnik you will not see a clear plateau in the "closed can" case because the liquid is contained in a constrained space. The ice formation raises the pressure and lowers the freezing point. Eventually the can will size-up or crack (or the freezer's temperature is reached). I uploaded a picture of the long term so you can appreciate it better. $\endgroup$
    – EyC
    Commented Sep 5, 2021 at 9:06
  • $\begingroup$ @EyC What this means then? : So I repeated the experiment with an intact, closed can.... with the clear plateau in the picture. OTOH for the open case,the freezing plateau occurs before the peak. So in neither of cases us the peak related to the freezing up period. $\endgroup$
    – Poutnik
    Commented Sep 5, 2021 at 9:17

Your Answer

By clicking “Post Your Answer”, you agree to our terms of service and acknowledge you have read our privacy policy.

Not the answer you're looking for? Browse other questions tagged or ask your own question.