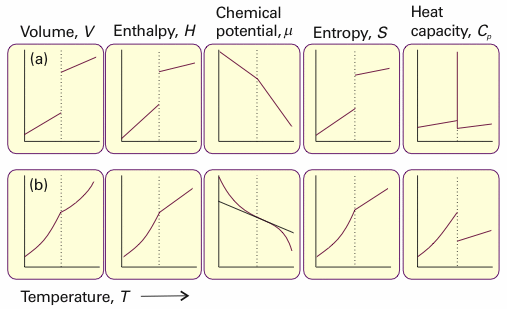
The $(b)$ part of the figure shows how thermodynamic variables change in a second order phase transformation. We observe there is a kink in the plot of volume with temperature.
Why is that so?
The plot is from http://faculty.chem.queensu.ca/people/faculty/mombourquette/Chem221/5_PhaseChanges/PhaseThermo.asp

