4
$\begingroup$

enter image description here

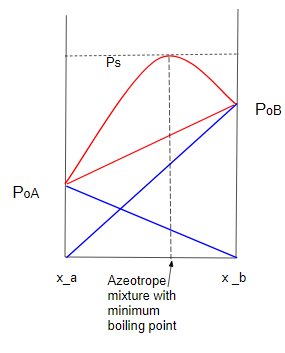
Consider two liquids with vapour pressures in pure form being ${P^o}_A$ and ${P^o}_B$. ${P^o}_B >{P^o}_A$ which implies liquid B is more volatile. If the liquids formed an ideal solution, then a straight line (drawn with red in the diagram) will be obtained for the vapour pressure of the solution. However, if they formed a non ideal solution with positive deviation, the red curve would have been obtained.

Now, we get a maxima on that curve. At that composition, the solution would be called a minimum boiling point azeotrope. I understand why minimum boiling point. It's because of the maximum vapour pressure but what I don't understand at all are these points:

  1. The azeotrope boils at a constant temperature.

  2. The composition of the azeotrope remains fixed while boiling.

  3. The azeotropic mixture cannot be separated by fractional distillation.

These points are really not explicit from the graph. I am not able to figure out the reasons for those points. Can someone please provide a mathematical/ intuitive view of azeotropes relating to these 3 properties?

Also, "in an azeotrope or constant temperature boiling mixture, the vapour has the same composition as the liquid." How can we confidently claim that the point of maxima is the point where the vapour has same composition as liquid?

$\endgroup$
6
  • 1
    $\begingroup$ chemistry.stackexchange.com/a/68641/59289 $\endgroup$
    – Iceberry
    Commented Aug 17, 2018 at 16:18
  • 1
    $\begingroup$ related chemistry.stackexchange.com/questions/5701/… and a lot of other questions... $\endgroup$
    – Mithoron
    Commented Aug 17, 2018 at 16:57
  • 1
    $\begingroup$ @Mithoron There are many related questions, but even I can't seem to find an answer specifically to these questions in a simple intuitive way. $\endgroup$
    – Iceberry
    Commented Aug 17, 2018 at 17:01
  • 3
    $\begingroup$ @Mithoron, not sure what you wanted here - the original photo was quite clear. Usually we don't like screenshots/pictures of lines and lines of text, but a diagram with a few words is generally okay. $\endgroup$ Commented Aug 17, 2018 at 18:06
  • 1
    $\begingroup$ @orthocresol It just looked bad IMO, new one looks better. $\endgroup$
    – Mithoron
    Commented Aug 17, 2018 at 18:13

1 Answer 1

1
$\begingroup$

I will first enumerate the four points that need to be addressed.

  1. The vapor and liquid phases have the same composition in an azeotrope.
  2. The azeotrope boils at a constant temperature.
  3. The composition of the azeotrope remains fixed while boiling.
  4. The azeotropic mixture cannot be separated by fractional distillation.

I will assume the definition of an azeotrope to be a solution whose composition is such that it exists at a local extremum of a Pxy or Txy plot. I prefer to instead take 1. as a definition, in which case my original definition follows as a property of an azeotrope, but both approaches are equivalent.

"Proof" of 1., by contradiction. Overlay the corresponding vapor pressure curve as a function of $y_A$ to make your plot a Pxy plot for species $A$. This new vapor pressure curve must touch the original curve at the azeotropic composition $x^*=y^*=z$, for otherwise a tie line would connect two vapor phases at some $P$, which is physically unreasonable.

Proof of 2. Refer to the Pxy plot from 1. The dew point and bubble point coincide at the azeotrope, so a phase transition happens only at one value of $P$ and hence only at one value of $T$.

Proof of 3. Refer to the Pxy plot from 1. The dew point and bubble point coincide at the azeotrope, and so must the compositions of each phase.

Proof of 4. Fractional distillation is based on the composition of the vapor and liquid phases being different. This is precluded by 3. in an azeotrope.

$\endgroup$
4
  • $\begingroup$ Thanks for the answer! What does this mean: "Overlay the corresponding vapor pressure curve as a function of y_a to make your plot a Pxy plot for species A. " Also, what's y? $\endgroup$
    – Archer
    Commented Aug 17, 2018 at 19:04
  • $\begingroup$ @Abcd, that quoted statement tells you to look at the Pxy plot for species $A$ (and provides a possible construction for doing so). $y_A$ is the mole fraction of species $A$ in the vapor phase, and $x_A$ the mole fraction of $A$ in the liquid phase. $\endgroup$ Commented Aug 17, 2018 at 19:09
  • $\begingroup$ Can you please elaborate on this bit: "This new vapor pressure curve must touch the original curve at the azeotropic composition x∗=y∗=z, for otherwise a tie line would connect two vapor phases at some P, which is physically unreasonable." ? (using a diagram if you don't mind) $\endgroup$
    – Archer
    Commented Aug 18, 2018 at 6:05
  • $\begingroup$ @Abcd, you can verify my statement by constructing a Pxy diagram where the two vapor pressure curves don’t touch and drawing a tie line between them. This line intersects with two vapor phases. $\endgroup$ Commented Aug 18, 2018 at 11:45

Your Answer

By clicking “Post Your Answer”, you agree to our terms of service and acknowledge you have read our privacy policy.

Not the answer you're looking for? Browse other questions tagged or ask your own question.