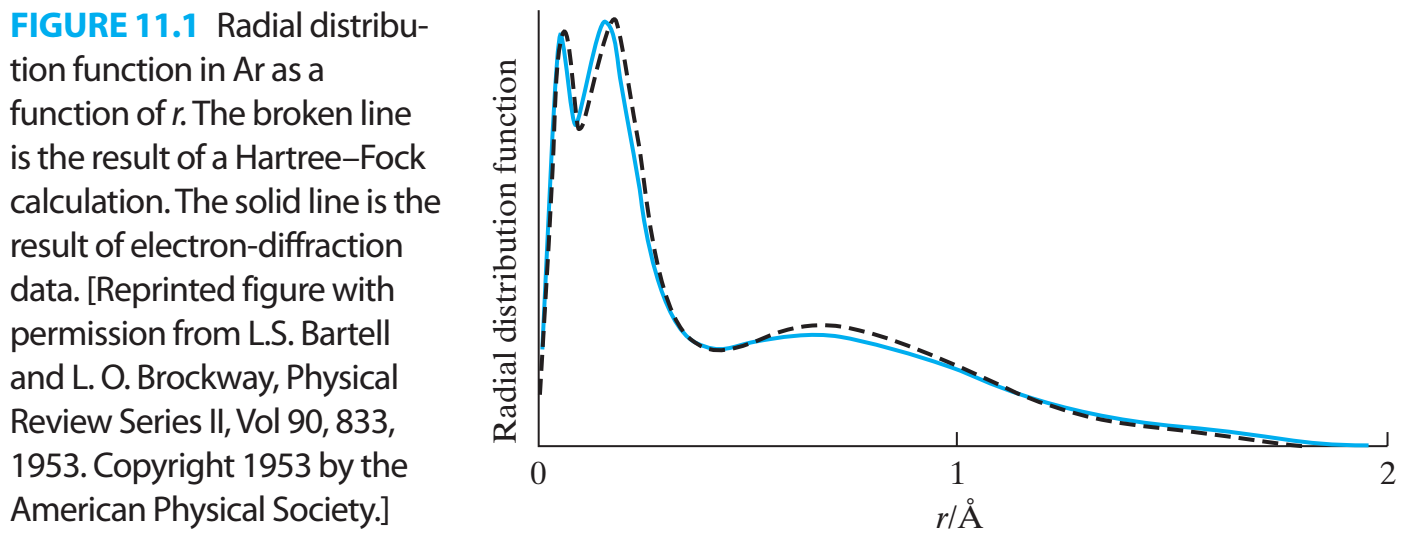
This is gladly not a big problem as MultiWFN (open source) can do that for you. I'll guide you through the process from start to finish. My current setup is Gaussian 09 Rev D.01 and MultiWFN 3.3.8; there are newer versions out there with which this should work, too.
Run the calculation, for example ar.com at the HF/STO-3G level of theory, but anything else will also be fine:
%chk=ar.chk
#P HF/STO-3G
gfinput gfoldprint iop(6/7=3)
symmetry(loose)
pop=full pop=nbo6

title card

0 1
Ar    0.0  0.0  0.0
This will generate a checkpoint file ar.chk which needs to be formatted:
formchk -3 ar.chk ar.fchk
Now fire up your MultiWFN program, you should get a prompt similar to the following:
 Multiwfn -- A Multifunctional Wavefunction Analyzer (for Linux)
 Version 3.3.8, release date: 2015-Dec-1
 Project leader: Tian Lu  (Beijing Kein Research Center for Natural Sciences)
 Citation of Multiwfn: Tian Lu, Feiwu Chen, J. Comp. Chem. 33, 580-592 (2012)
 Multiwfn official website: http://Multiwfn.codeplex.com
 Multiwfn official forum (in Chinese): http://bbs.keinsci.com
 Bug reporting, question and suggestion, please contact: [email protected]
 ( The number of threads:  2   Current date: 2017-03-09   Time: 14:46:57 )

 Input file path, for example E:\Haiyore!Nyaruko-san\Nyaruko.wfn
 (Supported types: .wfn/.wfx/.fch/.31/.chg/.pdb/.xyz/.cub/.grd/.molden, etc.)
 Hint: To reload the file last time used, simply input the letter "o". Input such as ?miku.fch can open miku.fch in the same folder of the file last time used
If you loaded MultiWFN from the directory you're files are located, simply put in ar.fchk. It will load the file and output some basic information and take you to the "Main function menu":
 Please wait...
 Loading various information of the wavefunction
 Loading basis-set definition...
 Loading orbitals...
 Converting basis function information to GTF information...
 Generating overlap matrix...
 Generating SCF density matrix...

 Total/Alpha/Beta electrons:     18.0000      9.0000      9.0000
 Net charge:     0.00000      Expected multiplicity:    1
 Atoms:      1,  Basis functions:      9,  GTFs:     27
 Total energy:  -521.222880802727 Hartree,   Virial ratio:  2.01704078
 This is a restricted single-determinant wavefunction
 Orbitals from 1 to     9 are occupied
 Title line of this file: title card
 Formula: Ar1
 Molecule weight:        39.94800

 Loaded ar.fchk successfully!

                    ------------ Main function menu ------------
For the sake of sanity I will not copy every menu screen here, just simply what you have to put in. On this screen the radial distribution function is hidden in the "Other functions (Part 2)" and there it is option 5, also see the manual chapter 3.200.5 on page 175 (v.3.3.8). So choose
200 // Other functions (2)
and then
5 // RDF
You should get the following menu:
   ====== Plot radial distribution function for a real space function ======
 -1 Exit
 0 Calculate radial distribution function and its integration curve
 1 Select real space function, current:   1
 2 Set sphere center, current    0.0000    0.0000    0.0000 Ang
 3 Set lower and upper limit of radial distance, current:   0.0000   5.0000 Ang
 4 Set the number of integration point in each shell, current:  2030
 5 Set the number of radial points, current:   500
Here you can select a couple of options. The electron density is already preselected, but you can change it in option 1. You'll get a table with all available functions.
The only thing you might want to adjust are the limits, so choose
3 // Limits
0.0,2.0
and calculate the RDF:
0 // Calculate RDF
Choose 1 to plot and view the function. Or choose
3 // Save graph
or choose
5 // Export to RDF.txt
for post-procesing (with gnuplot).
You can shorten the journey if you prepare a file like this mwfn.in
ar.fchk
200 // Other functions p2
5   // RDF menu
1   // Select real space fucntion
1   // Electron density
2   // Set sphere centre
0.0,0.0,0.0
3   // Set limits
0.0,2.0
0   // Calculate RDF
3   // Save graph
5   // export to text file
and pipe it into the program:
multiwfn < mwfn.in
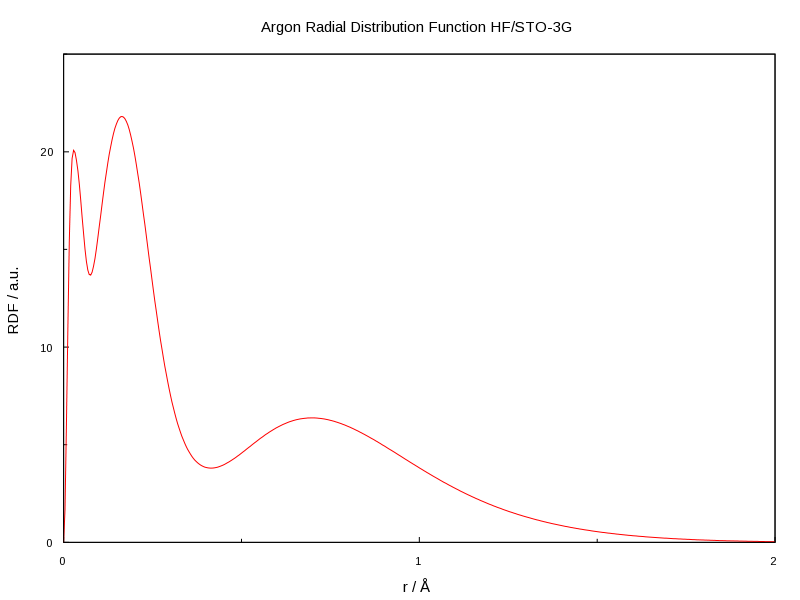
The native graphing capabilities of MultiWFN don't allow for customisation, so you might want to run it through gnuplot. Here is a file which gives you the graph below, I am using gnuplot 4.4, but later versions are more feature rich.
# General Settings
set terminal svg enhanced font "Arial,12" size 800,600
set tics font "Arial, 9"
set output "ar-rdf.svg"
unset key
#or set key top right Left # etc
set title 'Argon Radial Distribution Function HF/STO-3G'
#
# X-Axis: radius / angstrom
set xlabel 'r / Å'
set xtics in scale 0.6, 0.4 nomirror
set xtics 0,1
set mxtics 2
set xrange [0:2]
# Y-Axis: RDF/a.u.
set ylabel "RDF / a.u." rotate left
set ytics  in  scale 0.6, 0.4 nomirror
set ytics 0,10
set mytics 2
set yrange [0:25]
#
#
# PLOT!
plot \
     "RDF.txt"   using ($2):($3) title "HF/STO-3G"   with lines lt 1 axes x1y1
This is the resulting graph:


