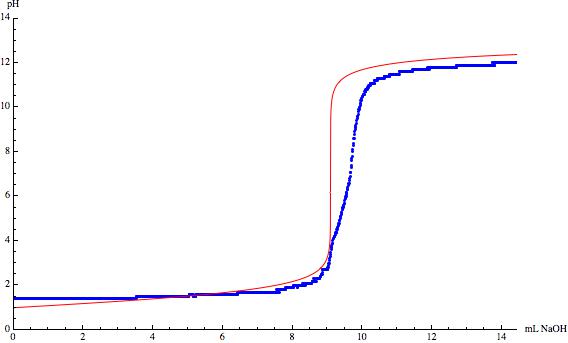
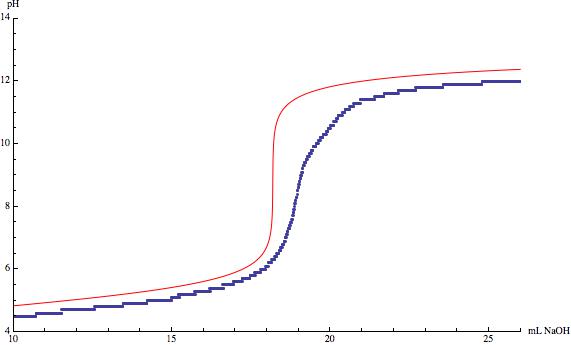
One thing that that has already been mentioned in the comments is the impact of $\ce{CO2}$ on the equilibrium. If you look at the following figure you can see the pH diagram of carbonic acid.
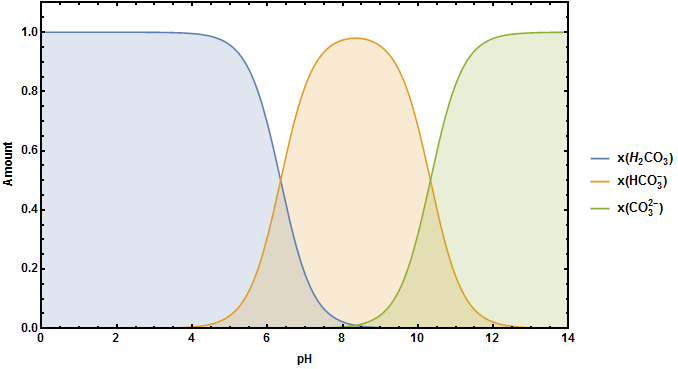
The equilibrium between $\ce{CO2}$ and $\ce{H2CO3}$ $$\ce{CO2 + H2O <=> H2CO3}$$ depends very much on the pH of your aqeous system. As long as it is sufficiently acidic no carbonic acid can/will react to form hydrogen carbonate or even further to carbonate. But from $\ce{pH}\approx4$ the possibility that hydrogen carbonate will be formed rises. This means for your titration, that you are not only titrating your acid anymore but you are also titrating the dissolved $\ce{CO2}$. The longer you wait for equlibration near the the equlibrium point the more dissolved $\ce{CO2}$ reacts to hydrogen carbonate and distorts your ideal $\ce{CO2}$-free titration curve.
To show you the impact more clearly I created the following figures showing both of your systems with varying carbonic acid concentrations $\left(0.00\ldots0.05~\ce{mol~L^{-1}}\right)$.
At first your system with hydrochloric acid:
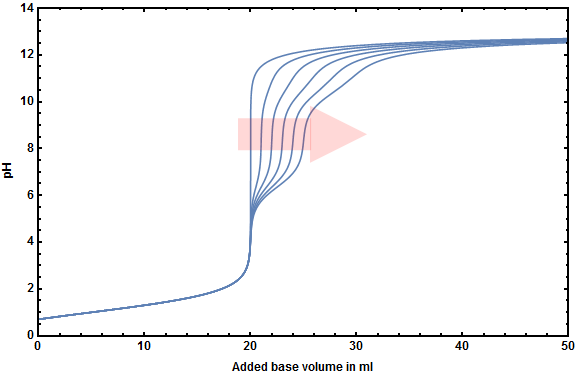
And secondly the system containing acetic acid:
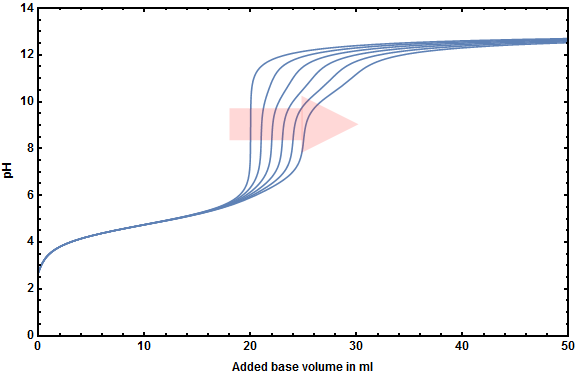
There are two remarking differences between both titration curves.
- You can determine the equlibrium point of the $\ce{HCl}$-titration (though it's not around pH 7 but at pH 4-5) no matter how many hydrogen carbonate will be formed during your titration.
- You have to pay attention during the titration of acetic acid because the inflection points gets distorted above any detectable other inflection point. However it is not that important as it seems because titrations of acetic acid are fast and there is usually not much time to dissolve enough $\ce{CO2}$.
The other points are already mentioned before. Your pH electrode could not be calibrated correctly and your concentrations might not be as precise as you think they are. The titration curve of hydrochloric acid looks like your acid was less concentrated which results in a higher starting pH and in a lower ending pH. The titration of acetic acid indeed looks like the electrode was not properly calibrated because it looks quite good if you just raise the pH values per measuring point and it suffers from dissolved $\ce{CO2}$ which is why the inflection point is shifted to a higher volume.
The mentioned increase of volume that is most times neglected during the calculation of titration curves has no big impact unless the concentration of the base is much lower than that of the acid that has to be titrated.
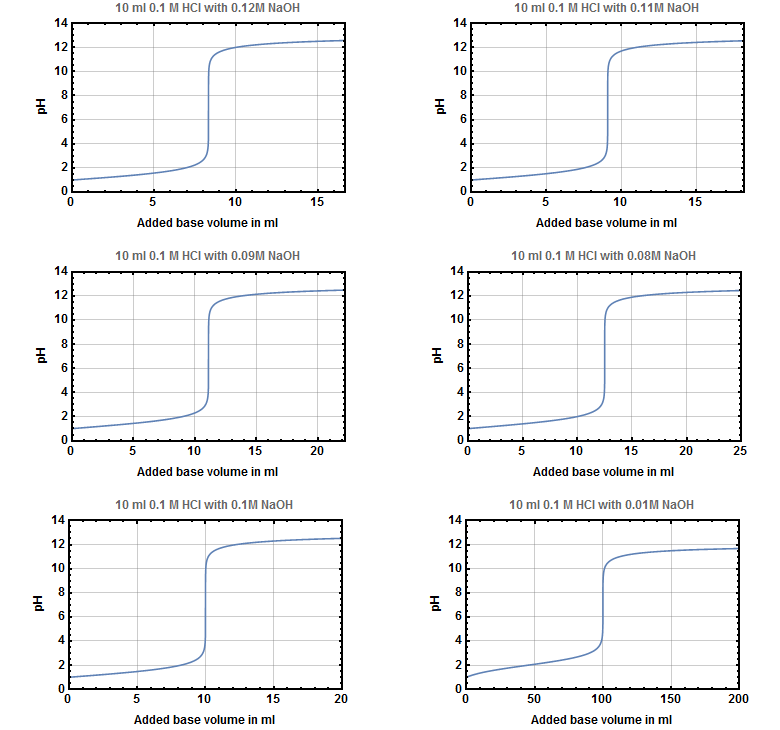
On the one hand the first four images show that different base concentrations around your ideal concentration don't effect the curve itself very much but only the needed volume to reach the point of inflection.
On the other hand you can see that there is a visible influence on the titration curve if the base is 10 times as diluted as the acid.
