1
$\begingroup$

G'day,

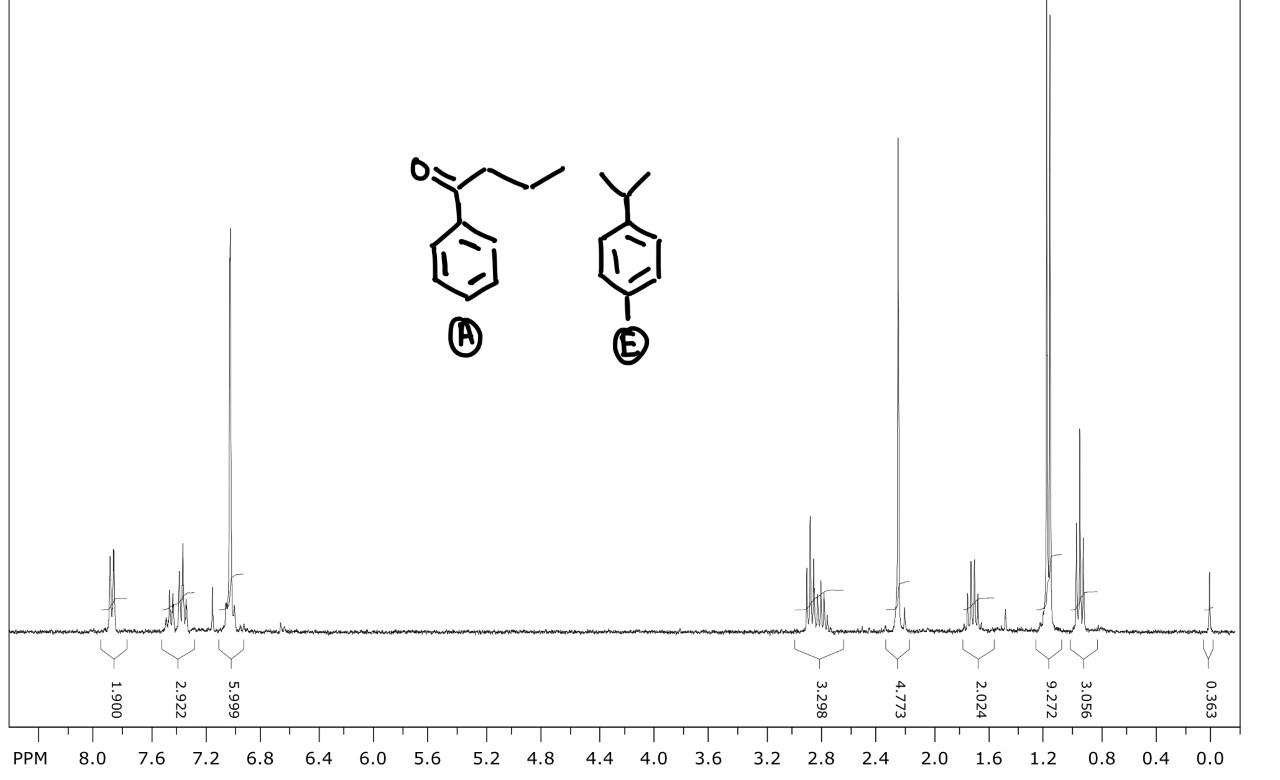
I am used to identifying molecular structure in isolation using proton and carbon NMR, but have never worked with a mixture before. The mixture relates to the following spectrum:

Mixture of Compounds A and E

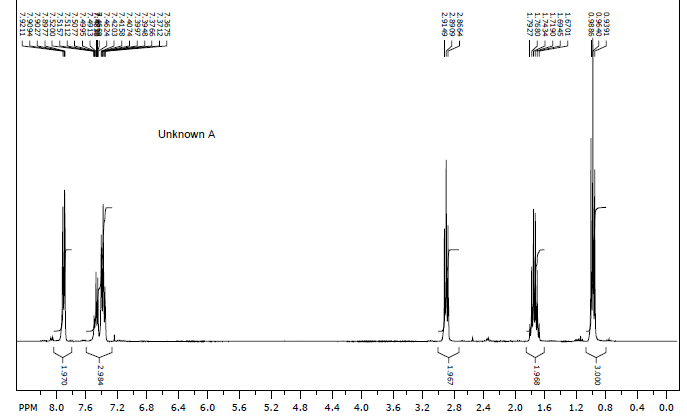
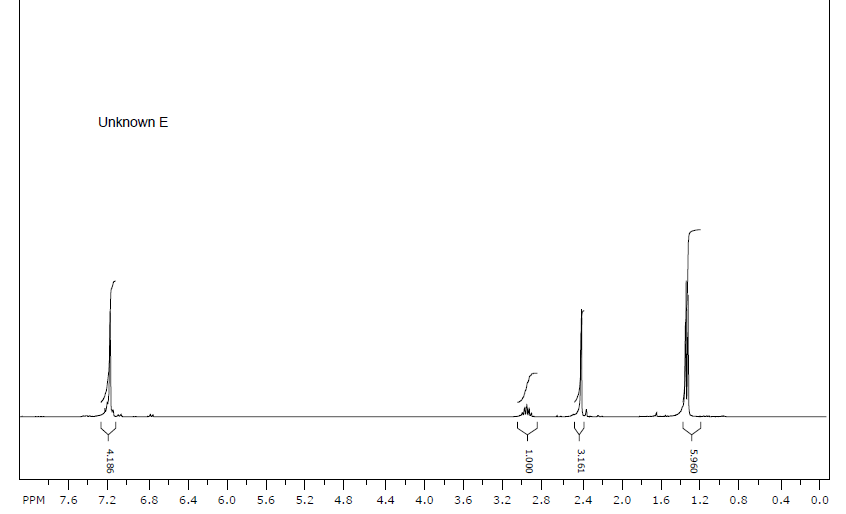
The spectra for compounds A and E are as follows:

Unknown A - 1-Phenylbutanone

Unknown E - para-isobutyltoluene

The spectra for the pure compounds were easy to delineate the structure, however it's the mixture that gave me the most trouble. I did some digging, and found a youtube video that gave me the following approach, in order to determine mole ratios:

mol(A)/mol(E) = integration(A)/integration(E)*N(E)/N(A)

The above relates to taking two signals, one from the pure spectrum of A, and one from the pure spectrum of E, and taking N, the number of hydrogens represented by those signals. Then looking at the NMR spectrum of the mixture, one can find the corresponding signal taken from A and E, and use the integration reported in the mixture NMR for the above equation.

Inspecting the pure spectra: there is a triplet in the spectra for unknown A at about 0.95 ppm, which represents three protons, and has a corresponding signal in the mixture at about the same chemical shift, with an integration of 3.056; and for the spectra of unknown E, there is doublet at about 1.32 ppm, which represents six protons, and has an integration in the mixed spectra of 9.272, with the signal shifted upfield to about 1.15 ppm. I suspect this could possibly be due to interactions between the components, perhaps van der Waal's forces.

Finally, returning these to the above equation:

mol(A)/mol(E) = (3.056/9.272)*(6/3) = 0.6592

Given the above equation can be related to the mass and molar mass of A and E as follows:

mol(A)/mol(E) = m(A)/m(E)*M(E)/M(A)

where M(A) = 148.08881 g/mol and M(E) = 134.10955 g/mol (taken from Mass Spectroscopy data)

and in the mixture, if the total mass m(T) = m(A)+m(E), then letting m(T)=100 g, one can solve for the percentage weight of each component, or %w/w as follows:

0.6592 = (100-m(E))/m(E)*(134.10955/148.08881)

Rearranging:

m(E) = (100 g)/1.7279 = 57.87 g

m(A) = 100 g - 57.87 g = 42.13 g

This the %w/w are 57.87% and 42.13% respectively.

This is where I hit a snag however, because if I were to chose other signals from the pure spectra and plug them into the above equation, I don't get the same %w/w. I know this to be a limitation, given no internal standard was used, thus %w/w is not absolute but relative. But what are other limitations, besides NMR being inherently insensitive and requiring large concentrations? How could I fix these limitations?

Appreciate the help in advance.

$\endgroup$
6
  • $\begingroup$ There should be a kind of averaged MW somewhere, in reference to weight. Is the mole ratio alone more independent of the peaks you choose? $\endgroup$
    – Alchimista
    Commented Sep 18, 2021 at 9:39
  • $\begingroup$ Integration is never going to be perfect, there’s some error. Make sure you use a long recovery delay if you want quantitative integrals. Speak to someone if you dont know how to set that up $\endgroup$ Commented Sep 18, 2021 at 10:48
  • $\begingroup$ The mole ratio was just to be taken from any two signals, one for each compound, that corresponded to the pure spectra, but had different integration and even chemical shift in the mixture spectrum. We didn't have a standard, so I suppose that would be why using different signals will give a different mole ratio. But again, it's a relative and not an absolute measurement. $\endgroup$ Commented Sep 18, 2021 at 13:25
  • $\begingroup$ On that note, why does the integration and chemical shift change when you have a mixture? I am unfamiliar with the recovery delay part too. If anyone wouldn't mind helping me address possible deficiencies, especially the concept of why NMR is an "insensitive" technique, I'd really appreciate it. $\endgroup$ Commented Sep 18, 2021 at 13:25
  • $\begingroup$ @Archimedes_Eureka My real suggestion re: your duplicated accounts, would be to repost your question with the account which you have a login for. There's not much information you're losing by doing so. I can delete this one. Re: the actual question: speak to somebody who does NMR at your institution about the recovery delay. You will end up needing their help anyway, if you want to rerun the spectrum. You are correct that the sensitivity of NMR is intrinsically low, but that is not an issue for the problem you're solving, it's not relevant. $\endgroup$ Commented Sep 18, 2021 at 14:22

2 Answers 2

2
$\begingroup$

If you want the best estimate from the existing spectra, add up the signal areas from the non-overlapping peaks (so not the signals near 2.8 ppm), add up the expected number of protons for those peaks, and use the formula you have. This will average out some of the noise.

If you want to know how many significant digits would be reasonable (less than 4), look at how much the ratios of integrals between peaks from the same component differ from the expected ratios. For example, the ratios for compound E (excluding the 2.8 ppm signal) are 3.88:3.09:6 instead of the expected 4:3:6, so they are off by more than 1%, but less than 10%. This means two significant figures might be reasonable.

If you want an estimate of the product distribution with more certainty, you should probably do experiments directly aimed at that (and probably do multiple runs of the synthesis to see how much variation there is from batch to batch).

$\endgroup$
0
$\begingroup$

If you resort to $\ce{^1H}$-NMR for an estimation of concentration you should look out for unique signals (here: either belonging to the butenone (A), or the cymene (E)) simple in shape (this prefers a singlet over a triplet), easy to recognize, which do not overlap with signals by the other compound, and still refer to similar nuclei in terms of their relaxation time in the NMR experiment.

As a suggestion:

  • the butanone (A, $\ce{C10H12O}$, $M_r = \pu{148.21 g/mol}$) exhibits a triplet around $\pu{0.96 ppm}$ to account for the terminal $\ce{-CH3}$ group (i.e., 3H)

  • the cymene(E, $\ce{C10H14}$, $M_r = \pu{134.22 g/mol}$) exhibts a singlet at about $\pu{2.4 ppm}$ for the toluene $\ce{-CH3}$ group (i.e., equally 3H).

  • for the spectrum of the mixture, you integrated $\pu{4.77 a.u.}$ ( $\approx \pu{2.2 ppm}$, E; possibly the small peak should not be included here), and $\pu{3.06 a.u.}$ ($\approx \pu{0.9 ppm}$, A).

  • since both signals report for 3H in their corresponding structure, the molecular concentrations of the analyte (excluding the solvent for the NMR and any other compound not recognizable by this technique) compute for

    $$c(\textbf{E}) = \frac{4.77}{4.77 + 3.06} \cdot 100\% = \pu{60.92 mol\%} $$

    $$c(\textbf{A}) = \frac{3.06}{7.83} \cdot 100\% = \pu{39.08 mol\%}$$

  • if interested in the mass concentration, you compute e.g.,

    $$c(\mathbf{E}) = \frac{0.6092 \cdot \pu{134.22 g/mol}}{(0.6092 \cdot \pu{134.22 g/mol}) + (0.3908 \cdot \pu{148.21 g/mol})} \cdot \pu{100\%}$$

    which yields $\pu{58.53 m\%}$.

If you want obtain data reliable enough, you should get in touch with your NMR group because the typical setup for the routine $\ce{^1H}$-NMR experiment favours high throughput of samples with a rather short $t_1$ time. However, the relaxation of the nuclei depends both on the chemical identity ($\ce{H}$, $\ce{C}$, $\ce{N}$) as well as its neighbors. Determine these $t_1$ times experimentally for your signals of interest ($0.5 \dots \approx \pu{5 s}$ for $\ce{^1H}$) and then adjust the NMR experiment to accommodate $3 \dots 5 \cdot t_1$ per individual FID recorded. Thus overall, recording a good spectrum to quantify components of a mixture takes a bit more time.

(One would record $\ce{^1H}$-NMR spectra of the pure components and a few samples within the molar range $0 \le x \le 1$ to ascertain that the peaks monitored do not move (too much) along the chemical shift while varying the concentration. For the two signals suggested, the variation ($\Delta\delta = f(c)$) and danger they overlap with signals of the other component however seems small. For reference samples used over a long time again and again, flame sealing an NMR tube is better than using the plastic cup.)

$\endgroup$

Your Answer

By clicking “Post Your Answer”, you agree to our terms of service and acknowledge you have read our privacy policy.

Not the answer you're looking for? Browse other questions tagged or ask your own question.