0
$\begingroup$

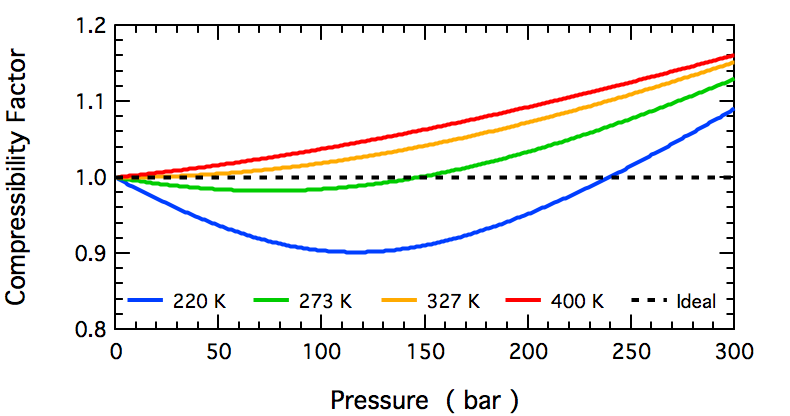
The following graph denotes the variation of the compressibility factor (Z) with pressure at different temperatures for a real gas. Simply each of the curves represents an isotherm.

enter image description here

Now, suppose we are not given the temperatures and we are asked to find the temperature relationship between the isotherms, how to prove the topmost curve corresponds to the higher temperature and the lowermost curve corresponds to the lowest temperature? Is there any mathematical proof for this or is this just an experimental result?

$\endgroup$
8
  • $\begingroup$ If might be possible to use statistical thermodynamics to show it. $\endgroup$ Commented Aug 28, 2019 at 11:17
  • $\begingroup$ @ChetMiller, Thanks for your comment. I don't know that topic. I thought of proving it like what we used to do for Boyle's law isotherms. I tried like that, but it was unsuccessful. $\endgroup$
    – Vishnu
    Commented Aug 28, 2019 at 11:37
  • $\begingroup$ Boyle's law assumes z = 1 $\endgroup$ Commented Aug 28, 2019 at 12:42
  • 1
    $\begingroup$ I'm not sure what you suggest is always true. At higher pressure the curves cross and the higher temperature curve becomes lower than at a lower temperature. You can see this beginning to happen in your plot. If you make a general 'corresponding states' plot, (using reduced values for a van -der-waals gas makes the plot common to may gasses) you can see the curves cross. Thus a general 'proof' is not possible. $\endgroup$
    – porphyrin
    Commented Aug 28, 2019 at 20:58
  • 1
    $\begingroup$ Yes, but lower pressure means different values for different gasses. The answer chemistry.stackexchange.com/questions/68984/… gives the reduced values for the van-der waals equation. From these you can make your own general plot. $\endgroup$
    – porphyrin
    Commented Aug 29, 2019 at 10:20

2 Answers 2

0
$\begingroup$

The compression factor $Z$ is defined as the ratio of the real molar volume with respect to the theoretical ideal

$$Z = \frac{V_m}{V_m^{ideal}}$$

where if $Z$ = 1, the gas behaves ideally.

If we want to get some sort of understanding for how this function behaves when you change the Pressures and Temperatures of your system, we need to substitute into this equation our variables of interest. To take the simplest approach, lets just use the ideal gas law as a substitute for $V_m$ (from a quantitative sense this doesn't make sense to do but qualitatively we can still derive some relationships therefrom) $$Z = \frac{RTP^{-1}}{V_m^{ideal}}$$ What this shows us is that $Z \propto T$. Thus, an increase in $T$ demonstrates an increase in $Z$, which is the qualitative understanding we're looking for herein.

To note, using a more realistic model for $V_m$ gets complicated; for example if you wanted to use the Van der Waals equation $$P = \frac{RT}{V_m-b} - \frac{a}{V_m^2}$$ instead of the ideal gas equation, the $V_m$ term doesn't reduce too nicely because of that $\frac{a}{V_m^2}$ term. Gets even worse for the Virial equations.

$\endgroup$
0
$\begingroup$

The seminal Van der Waals equation of state P=( RT/V-b)- a/V^2

where v = 1/ρ is molar volume. It can be rearranged by expanding 1/(v - b) into a Taylor’s series:

Z= 1+ (b- a/RT)1/V + (b^2/v^2) +( b^3/v^3)+........

The second virial coefficient has roughly the correct behavior, as it decreases monotonically when temperature is lowered. The third and higher virial coefficients are independent of temperature, and are definitely not correct, especially at low temperatures but can be considered here. Now as temp T increase so do Z.

$\endgroup$

Your Answer

By clicking “Post Your Answer”, you agree to our terms of service and acknowledge you have read our privacy policy.

Not the answer you're looking for? Browse other questions tagged or ask your own question.