added 82 characters in body
Source Link

Ienter image description hereI need help understanding the contour plot I mentioned. I have two questions:

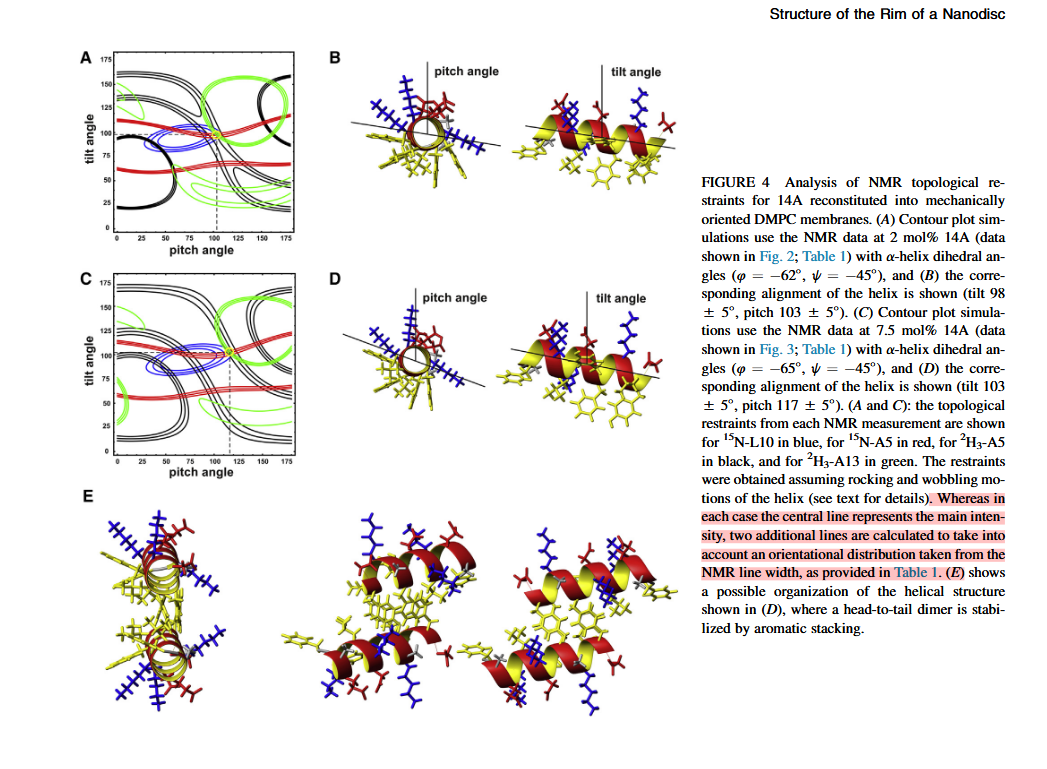
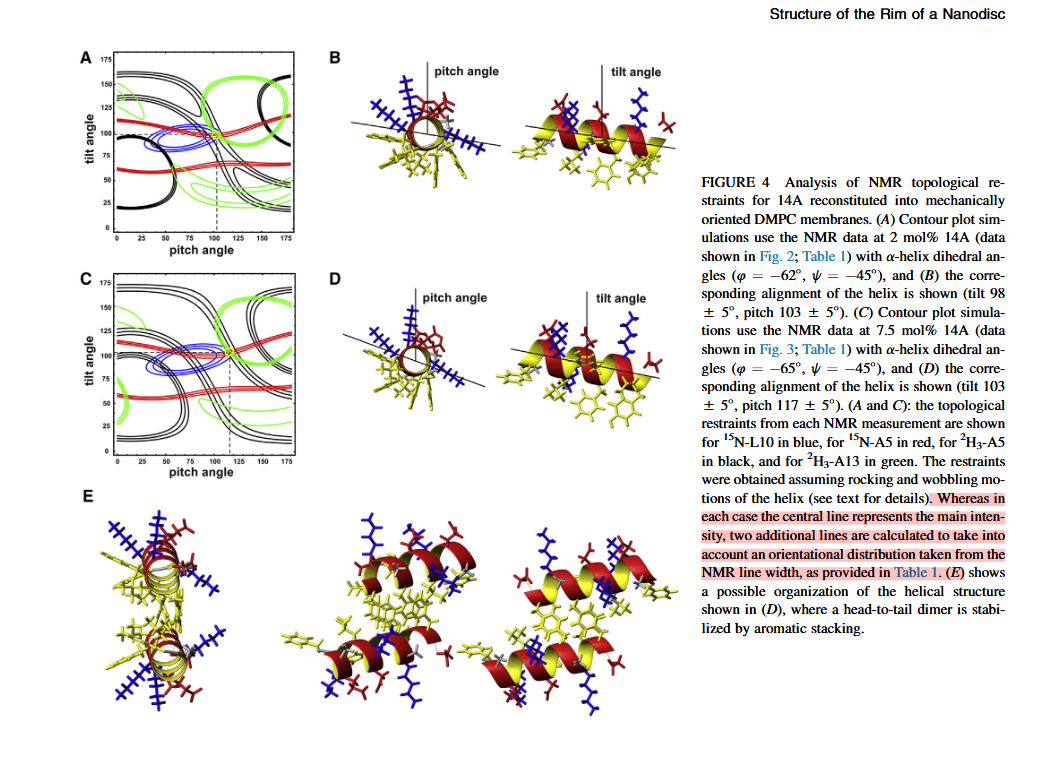
How do the authors relate the topological restraints to the theoretical model? As I understand it, the tilt vs. pitch angle contour map is from the theoretical model (PDB), but how do they connect this with the experimental NMR data?

In the contour map, the intersection points show where the theoretical model matches the experimental data. I don't fully understand how these intersections reflect that relationship. I have attached the screenshot of the contour map as well as link to the paper. https://www.cell.com/biophysj/biophysj/supplemental/S0006-3495(18)30766-5#fig3
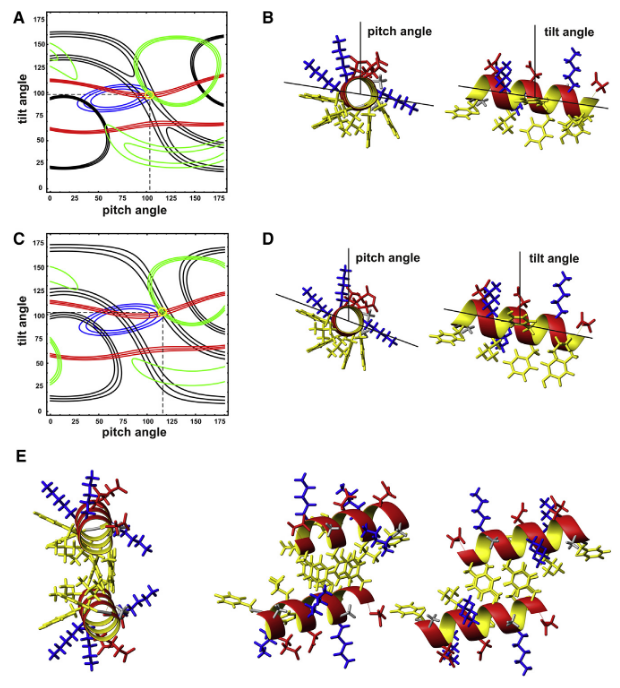
Figure 4 from above reference FIGURE 4. Analysis of NMR topological restraints for 14A reconstituted into mechanically oriented DMPC membranes. (A) Contour plot simulations use the NMR data at 2 mol% 14A (data shown in Fig. 2; Table 1) with $\alpha$-helix dihedral angles $(\phi = -62^\circ , \ \psi = -45^\circ )$, and (B) the corresponding alignment of the helix is shown (tilt $98 \pm 5^\circ$, pitch $103 \pm 5^\circ$). (C) Contour plot simulations use the NMR data at 7.5 mol% 14A (data shown in Fig. 3; Table 1) with $\alpha$-helix dihedral angles $(\phi = -62^\circ , \ \psi = -45^\circ)$, and (D) the corresponding alignment of the helix is shown (tilt $103 \pm 5^\circ$, pitch $117 \pm 5^\circ$). (A and C): the topological restraints from each NMR measurement are shown for $\ce{^{15}N}$-L10 in blue, for $\ce{^{15}N}$-A5 in red, for $\ce{^{2}H3}$-A5 in black, and for $\ce{^{2}H3}$-A13 in green. The restraints were obtained assuming rocking and wobbling motions of the helix (see text for details). Whereas in each case the central line represents the main intensity, two additional lines are calculated to take into account an orientational distribution taken from the NMR line width, as provided in Table 1. (E) shows a possible organization of the helical structure shown in (D), where a head-to-tail dimer is stabilized by aromatic stacking.

I need help understanding the contour plot I mentioned. I have two questions:

How do the authors relate the topological restraints to the theoretical model? As I understand it, the tilt vs. pitch angle contour map is from the theoretical model (PDB), but how do they connect this with the experimental NMR data?

In the contour map, the intersection points show where the theoretical model matches the experimental data. I don't fully understand how these intersections reflect that relationship. I have attached the screenshot of the contour map as well as link to the paper. https://www.cell.com/biophysj/biophysj/supplemental/S0006-3495(18)30766-5#fig3

Figure 4 from above reference FIGURE 4. Analysis of NMR topological restraints for 14A reconstituted into mechanically oriented DMPC membranes. (A) Contour plot simulations use the NMR data at 2 mol% 14A (data shown in Fig. 2; Table 1) with $\alpha$-helix dihedral angles $(\phi = -62^\circ , \ \psi = -45^\circ )$, and (B) the corresponding alignment of the helix is shown (tilt $98 \pm 5^\circ$, pitch $103 \pm 5^\circ$). (C) Contour plot simulations use the NMR data at 7.5 mol% 14A (data shown in Fig. 3; Table 1) with $\alpha$-helix dihedral angles $(\phi = -62^\circ , \ \psi = -45^\circ)$, and (D) the corresponding alignment of the helix is shown (tilt $103 \pm 5^\circ$, pitch $117 \pm 5^\circ$). (A and C): the topological restraints from each NMR measurement are shown for $\ce{^{15}N}$-L10 in blue, for $\ce{^{15}N}$-A5 in red, for $\ce{^{2}H3}$-A5 in black, and for $\ce{^{2}H3}$-A13 in green. The restraints were obtained assuming rocking and wobbling motions of the helix (see text for details). Whereas in each case the central line represents the main intensity, two additional lines are calculated to take into account an orientational distribution taken from the NMR line width, as provided in Table 1. (E) shows a possible organization of the helical structure shown in (D), where a head-to-tail dimer is stabilized by aromatic stacking.

enter image description hereI need help understanding the contour plot I mentioned. I have two questions:

How do the authors relate the topological restraints to the theoretical model? As I understand it, the tilt vs. pitch angle contour map is from the theoretical model (PDB), but how do they connect this with the experimental NMR data?

In the contour map, the intersection points show where the theoretical model matches the experimental data. I don't fully understand how these intersections reflect that relationship. I have attached the screenshot of the contour map as well as link to the paper. https://www.cell.com/biophysj/biophysj/supplemental/S0006-3495(18)30766-5#fig3

Figure 4 from above reference FIGURE 4. Analysis of NMR topological restraints for 14A reconstituted into mechanically oriented DMPC membranes. (A) Contour plot simulations use the NMR data at 2 mol% 14A (data shown in Fig. 2; Table 1) with $\alpha$-helix dihedral angles $(\phi = -62^\circ , \ \psi = -45^\circ )$, and (B) the corresponding alignment of the helix is shown (tilt $98 \pm 5^\circ$, pitch $103 \pm 5^\circ$). (C) Contour plot simulations use the NMR data at 7.5 mol% 14A (data shown in Fig. 3; Table 1) with $\alpha$-helix dihedral angles $(\phi = -62^\circ , \ \psi = -45^\circ)$, and (D) the corresponding alignment of the helix is shown (tilt $103 \pm 5^\circ$, pitch $117 \pm 5^\circ$). (A and C): the topological restraints from each NMR measurement are shown for $\ce{^{15}N}$-L10 in blue, for $\ce{^{15}N}$-A5 in red, for $\ce{^{2}H3}$-A5 in black, and for $\ce{^{2}H3}$-A13 in green. The restraints were obtained assuming rocking and wobbling motions of the helix (see text for details). Whereas in each case the central line represents the main intensity, two additional lines are calculated to take into account an orientational distribution taken from the NMR line width, as provided in Table 1. (E) shows a possible organization of the helical structure shown in (D), where a head-to-tail dimer is stabilized by aromatic stacking.

Modified the text body and the image. The legend of the image is deleted and put in typing under the image for better view.
Source Link
Mathew Mahindaratne
  • 42.1k
  • 29
  • 56
  • 111

I need help understanding the contour plot I mentioned. I have two questions:

How do the authors relate the topological restraints to the theoretical model? As I understand it, the tilt vs. pitch angle contour map is from the theoretical model (PDB), but how do they connect this with the experimental NMR data?

How do the authors relate the topological restraints to the theoretical model? As I understand it, the tilt vs. pitch angle contour map is from the theoretical model (PDB), but how do they connect this with the experimental NMR data?

In the contour map, the intersection points show where the theoretical model matches the experimental data. I don't fully understand how these intersections reflect that relationship. I have attached the screenshot of the contour map as well as link to the paper. https://www.cell.com/biophysj/biophysj/supplemental/S0006-3495(18)30766-5#fig3

Figure 4 from above reference enter image description hereFIGURE 4. Analysis of NMR topological restraints for 14A reconstituted into mechanically oriented DMPC membranes. (A) Contour plot simulations use the NMR data at 2 mol% 14A (data shown in Fig. 2; Table 1) with $\alpha$-helix dihedral angles $(\phi = -62^\circ , \ \psi = -45^\circ )$, and (B) the corresponding alignment of the helix is shown (tilt $98 \pm 5^\circ$, pitch $103 \pm 5^\circ$). (C) Contour plot simulations use the NMR data at 7.5 mol% 14A (data shown in Fig. 3; Table 1) with $\alpha$-helix dihedral angles $(\phi = -62^\circ , \ \psi = -45^\circ)$, and (D) the corresponding alignment of the helix is shown (tilt $103 \pm 5^\circ$, pitch $117 \pm 5^\circ$). (A and C): the topological restraints from each NMR measurement are shown for $\ce{^{15}N}$-L10 in blue, for $\ce{^{15}N}$-A5 in red, for $\ce{^{2}H3}$-A5 in black, and for $\ce{^{2}H3}$-A13 in green. The restraints were obtained assuming rocking and wobbling motions of the helix (see text for details). Whereas in each case the central line represents the main intensity, two additional lines are calculated to take into account an orientational distribution taken from the NMR line width, as provided in Table 1. (E) shows a possible organization of the helical structure shown in (D), where a head-to-tail dimer is stabilized by aromatic stacking.

I need help understanding the contour plot I mentioned. I have two questions:

How do the authors relate the topological restraints to the theoretical model? As I understand it, the tilt vs. pitch angle contour map is from the theoretical model (PDB), but how do they connect this with the experimental NMR data?

In the contour map, the intersection points show where the theoretical model matches the experimental data. I don't fully understand how these intersections reflect that relationship. I have attached the screenshot of the contour map as well as link to the paper. https://www.cell.com/biophysj/biophysj/supplemental/S0006-3495(18)30766-5#fig3 enter image description here

I need help understanding the contour plot I mentioned. I have two questions:

How do the authors relate the topological restraints to the theoretical model? As I understand it, the tilt vs. pitch angle contour map is from the theoretical model (PDB), but how do they connect this with the experimental NMR data?

In the contour map, the intersection points show where the theoretical model matches the experimental data. I don't fully understand how these intersections reflect that relationship. I have attached the screenshot of the contour map as well as link to the paper. https://www.cell.com/biophysj/biophysj/supplemental/S0006-3495(18)30766-5#fig3

Figure 4 from above reference FIGURE 4. Analysis of NMR topological restraints for 14A reconstituted into mechanically oriented DMPC membranes. (A) Contour plot simulations use the NMR data at 2 mol% 14A (data shown in Fig. 2; Table 1) with $\alpha$-helix dihedral angles $(\phi = -62^\circ , \ \psi = -45^\circ )$, and (B) the corresponding alignment of the helix is shown (tilt $98 \pm 5^\circ$, pitch $103 \pm 5^\circ$). (C) Contour plot simulations use the NMR data at 7.5 mol% 14A (data shown in Fig. 3; Table 1) with $\alpha$-helix dihedral angles $(\phi = -62^\circ , \ \psi = -45^\circ)$, and (D) the corresponding alignment of the helix is shown (tilt $103 \pm 5^\circ$, pitch $117 \pm 5^\circ$). (A and C): the topological restraints from each NMR measurement are shown for $\ce{^{15}N}$-L10 in blue, for $\ce{^{15}N}$-A5 in red, for $\ce{^{2}H3}$-A5 in black, and for $\ce{^{2}H3}$-A13 in green. The restraints were obtained assuming rocking and wobbling motions of the helix (see text for details). Whereas in each case the central line represents the main intensity, two additional lines are calculated to take into account an orientational distribution taken from the NMR line width, as provided in Table 1. (E) shows a possible organization of the helical structure shown in (D), where a head-to-tail dimer is stabilized by aromatic stacking.

Source Link

How to understand the contour plot of NMR data of peptide reconsituited into mechanical oriented DMPC membrane?

I need help understanding the contour plot I mentioned. I have two questions:

How do the authors relate the topological restraints to the theoretical model? As I understand it, the tilt vs. pitch angle contour map is from the theoretical model (PDB), but how do they connect this with the experimental NMR data?

In the contour map, the intersection points show where the theoretical model matches the experimental data. I don't fully understand how these intersections reflect that relationship. I have attached the screenshot of the contour map as well as link to the paper. https://www.cell.com/biophysj/biophysj/supplemental/S0006-3495(18)30766-5#fig3 enter image description here